Playground
On this page you can send messages directly to deployed models, compare multiple Servings side by side, and experiment with prompts and parameters. Use it to validate response quality before deploying a service, compare models, and tune parameters.
Click the Playground item in the left sidebar to navigate to the Playground page. Use the Device / Model tabs at the top of the page to switch the kind of metrics shown in the top status bar. Both tabs provide the same chat UI; only the metrics shown in the status bar differ.
| Tab | Status Bar Metrics |
|---|---|
| Device | Hardware metrics — CPU / Temperature / Power / Memory |
| Model | Inference performance metrics — TTFT / ITL / Output TPS / Performance/Watt (tok/s/W) |
Below is an example of the Device tab with a GPU deployment selected. After sending a chat message, the top status bar updates utilization, temperature, power, and memory in real time. Clicking the status bar shows a time series chart for the last 5 minutes.
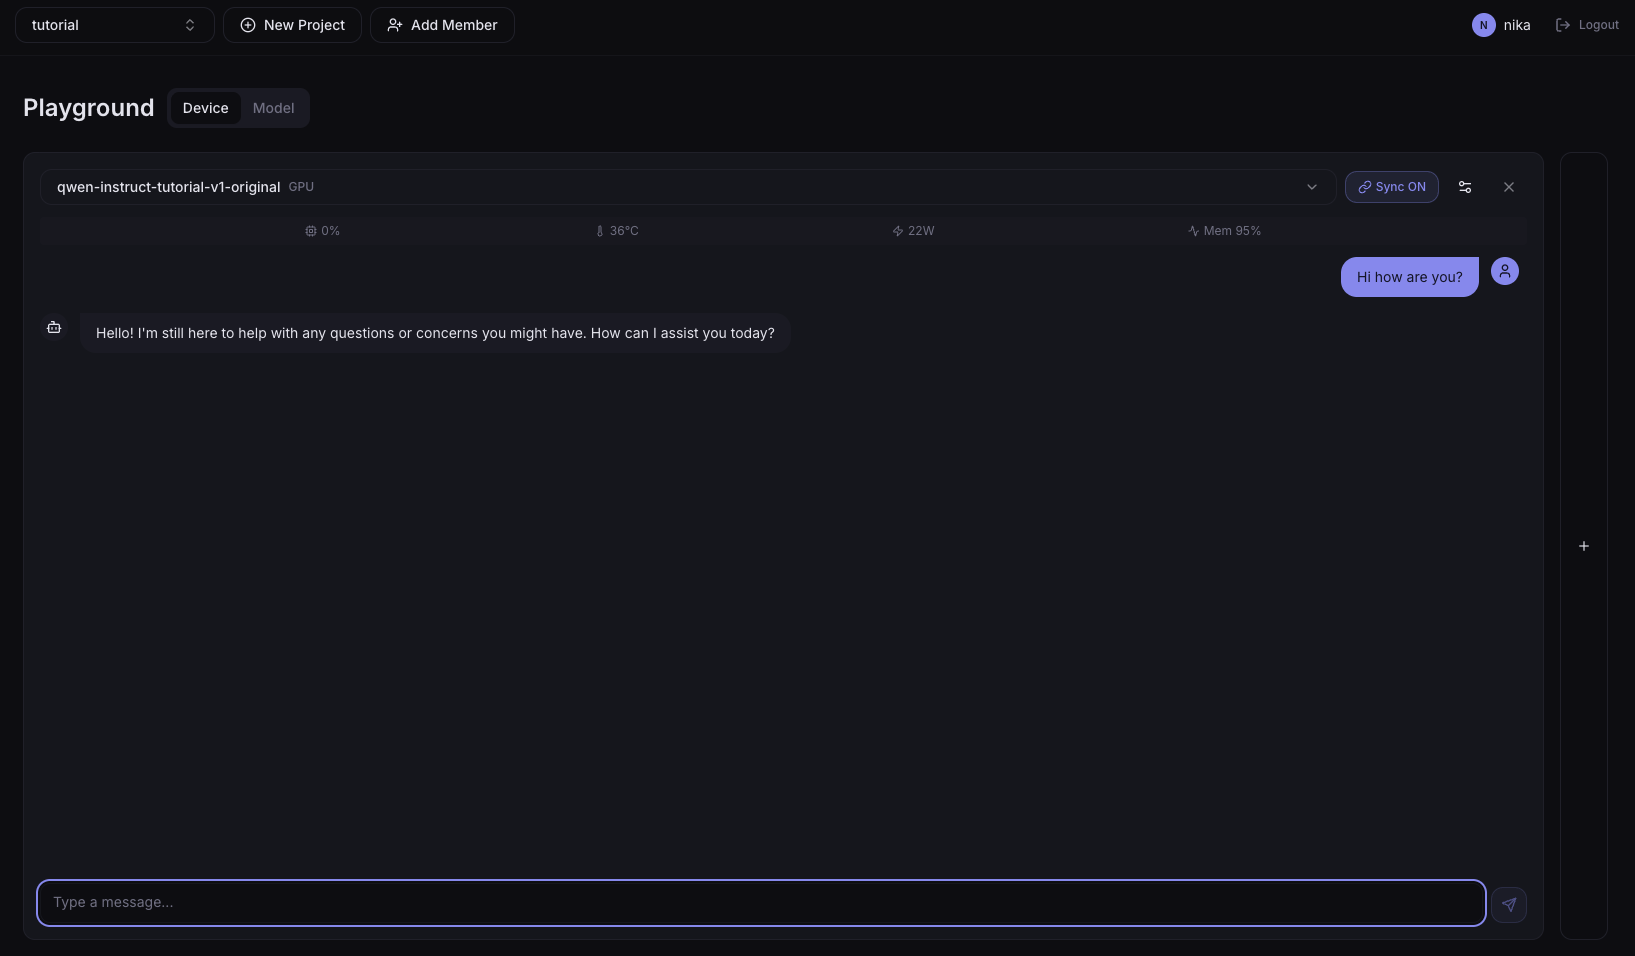
Device Tab
The Device tab shows the chat UI alongside hardware metrics.
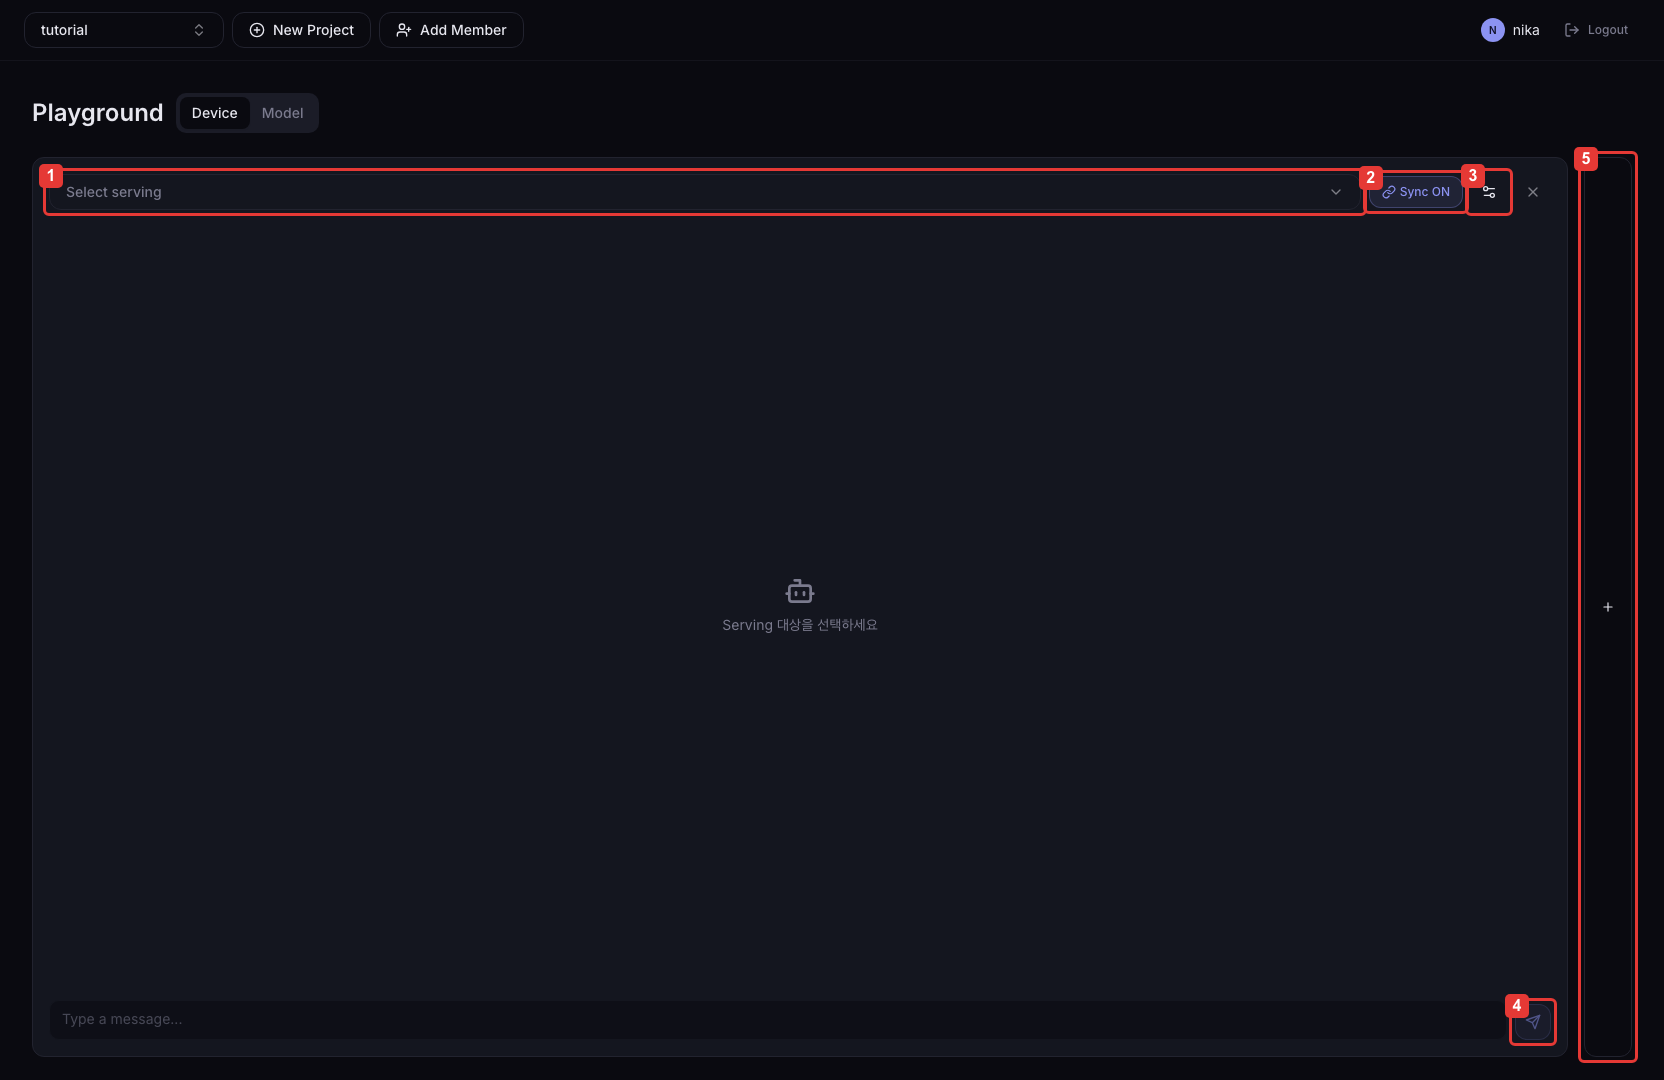
| Number | Description |
|---|---|
| ① | Dropdown to select the Serving to compare. Only Servings that support the OpenAI-compatible API are shown. |
| ② | When enabled, sends the same message to all panels at once for response comparison. |
| ③ | Configure inference parameters such as System Prompt, Temperature, Max Tokens, Top P. |
| ④ | Send the message from the current panel. Responses are streamed via SSE. |
| ⑤ | Add a comparison panel. Up to 4 can be placed side by side. |
Model Tab — Inference Performance Metrics
The Model tab provides the same chat UI as the Device tab, but the top status bar is replaced with LLM inference performance metrics instead of hardware metrics. While chatting with the model, you can monitor service response quality metrics such as TTFT and TPS in real time — useful when comparing GPU vs NPU deployments or monitoring the results of parameter tuning with numbers.
The following 4 metrics are displayed in real time on the PanelInferenceBar status bar.
| Metric | Description |
|---|---|
| TTFT(p50) | Median time until the first token is generated (Time To First Token, milliseconds) |
| ITL(p50) | Median time between successive tokens (Inter-token Latency, milliseconds) |
| Output TPS | Output tokens per second (Tokens Per Second) |
| Tokens/sec/Watt | Tokens generated per watt of power consumption (performance/watt) |
Clicking the PanelInferenceBar shows a time series popover for the last 5 minutes. You can inspect trends across four line charts: TTFT, ITL, Output TPS, and tok/s/W.
- GPU (NVIDIA) deployment: vLLM metrics (
vllm:*) + DCGM power metrics - RNGD (Furiosa) deployment: furiosa-llm metrics (
furiosa_llm_*) +furiosa_npu_hw_power
The metric source is selected automatically based on the accelerator type assigned to the Serving.
Selecting a Serving and Sync
In the ① Select Serving dropdown at the top of each panel, select the Serving to compare. Only Servings that support the OpenAI-compatible API (/v1/chat/completions) appear in the list.
When you enable the ② Sync button, the same message is sent to all panels at once, so you can compare responses in one shot.
Parameter Settings
Click the ③ Settings button to adjust parameters or reset the conversation.
| Parameter | Description | Range | Default |
|---|---|---|---|
| System Prompt | Pre-instruction that defines the model's role and behavior | — | — |
| Temperature | Controls response randomness. Higher = more diverse and creative; lower = more consistent. | 0 – 2 | 0.7 |
| Max Tokens | Maximum number of tokens to generate | 1 – 4096 | 2048 |
| Top P | Sample only from the highest-probability tokens. Controls diversity together with Temperature. | 0 – 1 | 1.0 |
| Presence Penalty | Reduce repetition of already-mentioned topics to encourage new ones | 0 – 2 | 0.0 |
| Frequency Penalty | Reduce repeated use of the same words/phrases to diversify expression | 0 – 2 | 0.0 |
Generally adjust only one of Temperature and Top P. Tuning both away from their defaults can produce unpredictable responses.