Serving
This page walks you through deploying and managing an AI model as an NPU/GPU-based inference service.
Serving List
In the left sidebar, click Development > Serving.
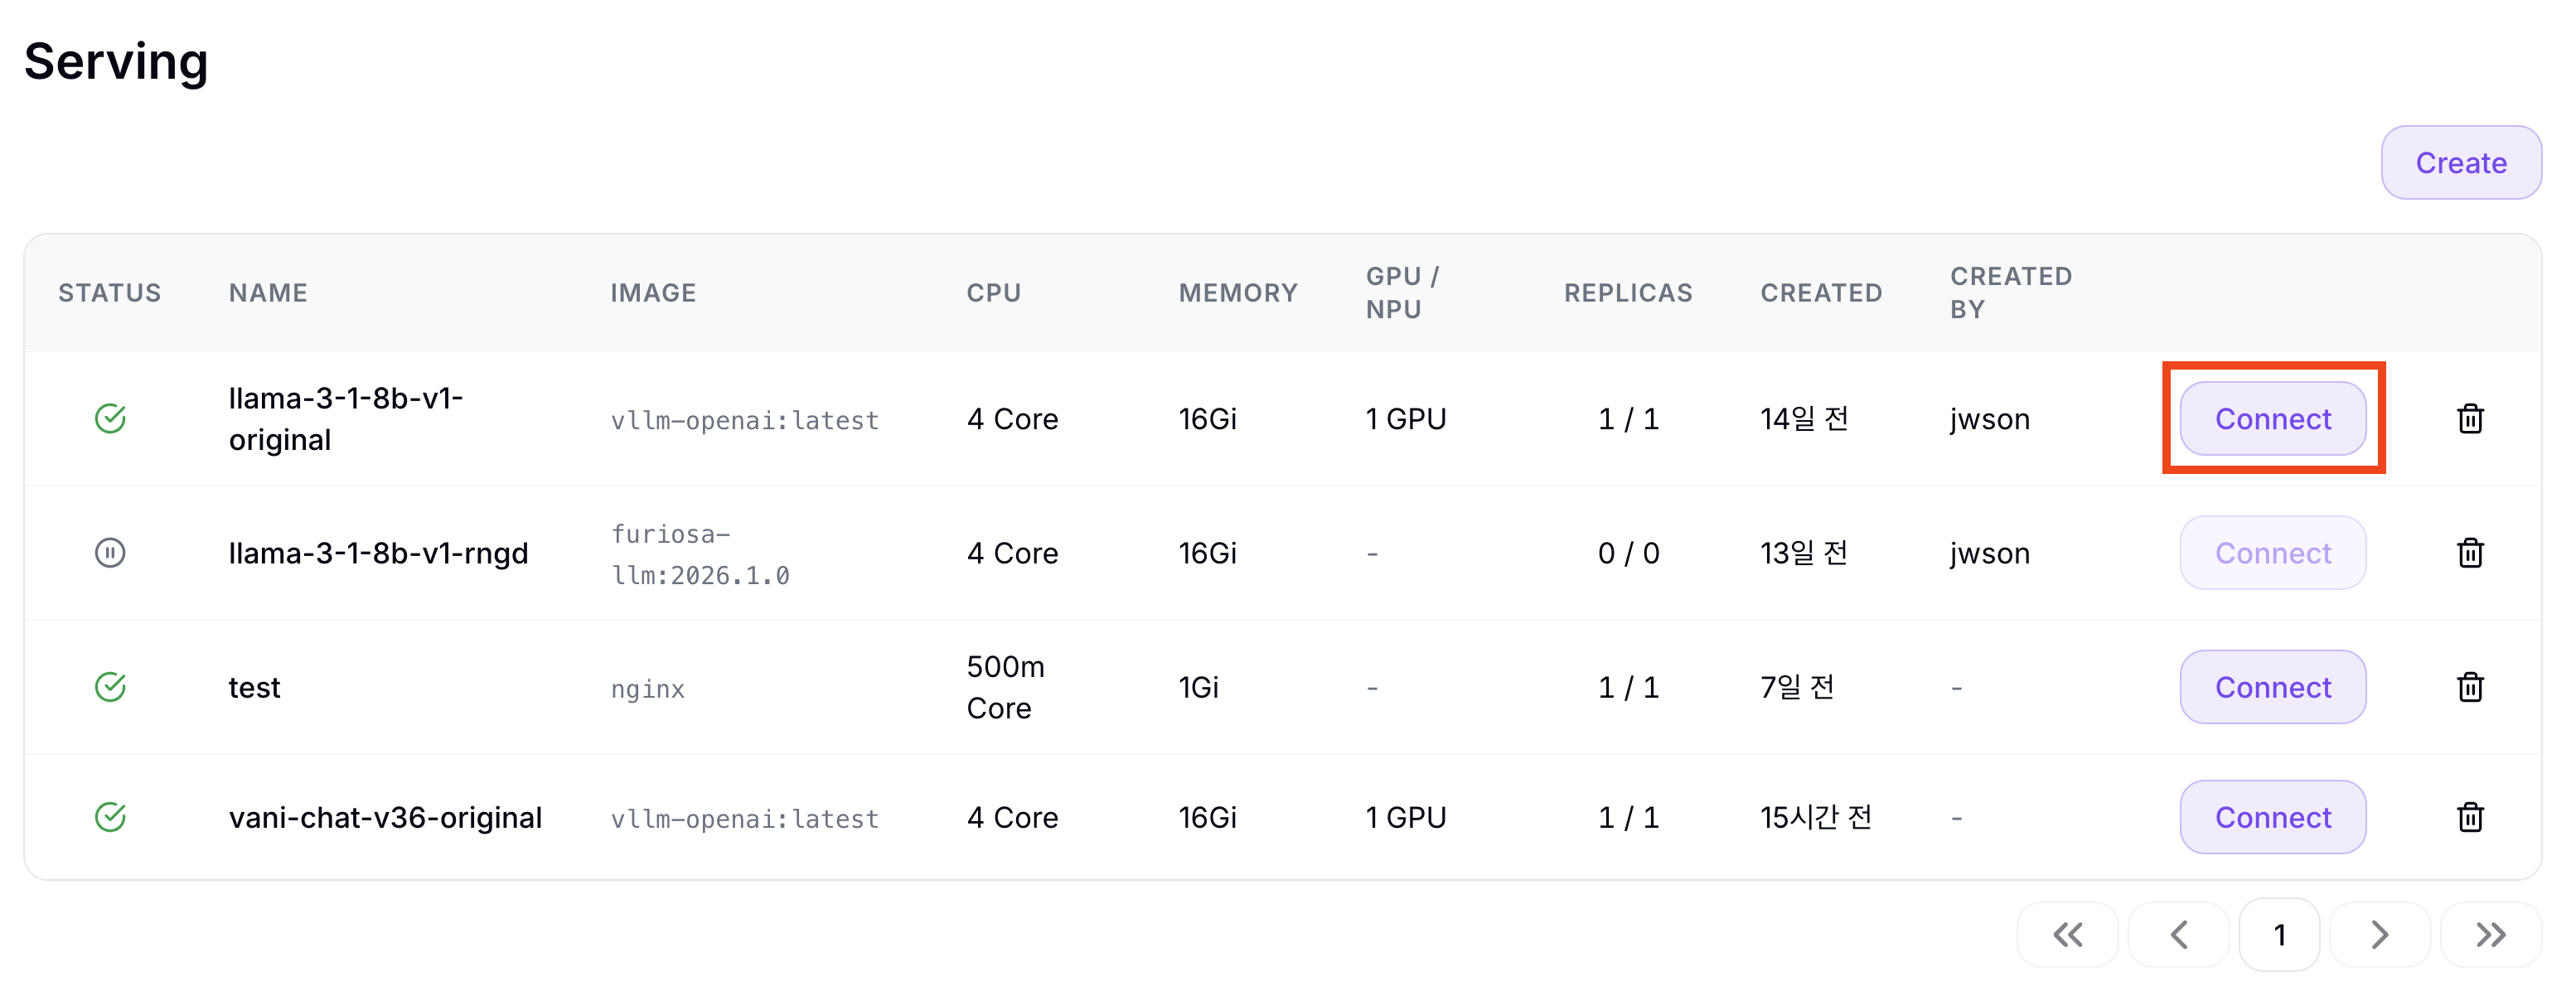
Click the Connect button to open the deployed service's endpoint in a new tab. The inference endpoint URL is subdomain-based, in the form https://<deployment-name>-<project>.<base-domain>. Append the inference framework's API path (e.g., /v1/chat/completions) to send inference requests from outside.
For example, if the tutorial-npu-serving Serving is in the public-space project and can be accessed without authentication, you can test it directly with this command.
curl -X POST 'https://tutorial-npu-serving-public-space.nufi.com/v1/chat/completions' \
  -H 'Content-Type: application/json' \
  -d '{"model": "model-name", "messages": [{"role": "user", "content": "Hello"}]}'
Status
| Status | Description | Recovery |
|---|---|---|
| Ready | All Pods are in the Ready state. The service is operating normally. | — |
| Starting | Pods are starting. Not yet Ready, e.g., still loading the model. | Wait briefly. If it persists, check the logs. |
| Degraded | Only some Pods are Ready. Requests are still served but overall performance is reduced. | Check the logs and events of the failing Pods. |
| Error | One or more Pods are in an error state such as CrashLoopBackOff. | Click the Status column → check failureReason and logs in the popover. |
| Pending | Pods are not scheduled. Resource shortage or image pull failure. | Check cluster resource availability and image settings. |
| Scaled Down | Replicas were scaled to 0. | Change Replicas to 1 or more if needed. |
Hover or click on the Status column to see the Pod status popover. The popover includes the main error reason, the Ready count, the list of failing Pods, and a View logs link for each Pod (opens a new tab to the Logs tab).
Create a Serving
Click Create to go to the creation page. Creation proceeds in 3 steps.
- Step 1. Basic Information
- Step 2. Detailed Settings
- Step 3. Review & Deploy

| Field | Description | Required |
|---|---|---|
| Service Name | Serving name (lowercase, digits, hyphens, up to 63 characters) | ✓ |
| Description | Serving description | - |
| Select Template | Inference framework template selection (vLLM / Custom) | ✓ |
Service Name Rules
- Lowercase letters, digits, and hyphens (-) are allowed
- Must not start or end with a hyphen
- Up to 63 characters (Kubernetes limit)
Examples: my-model-v1, llm-server-prod
Common settings:
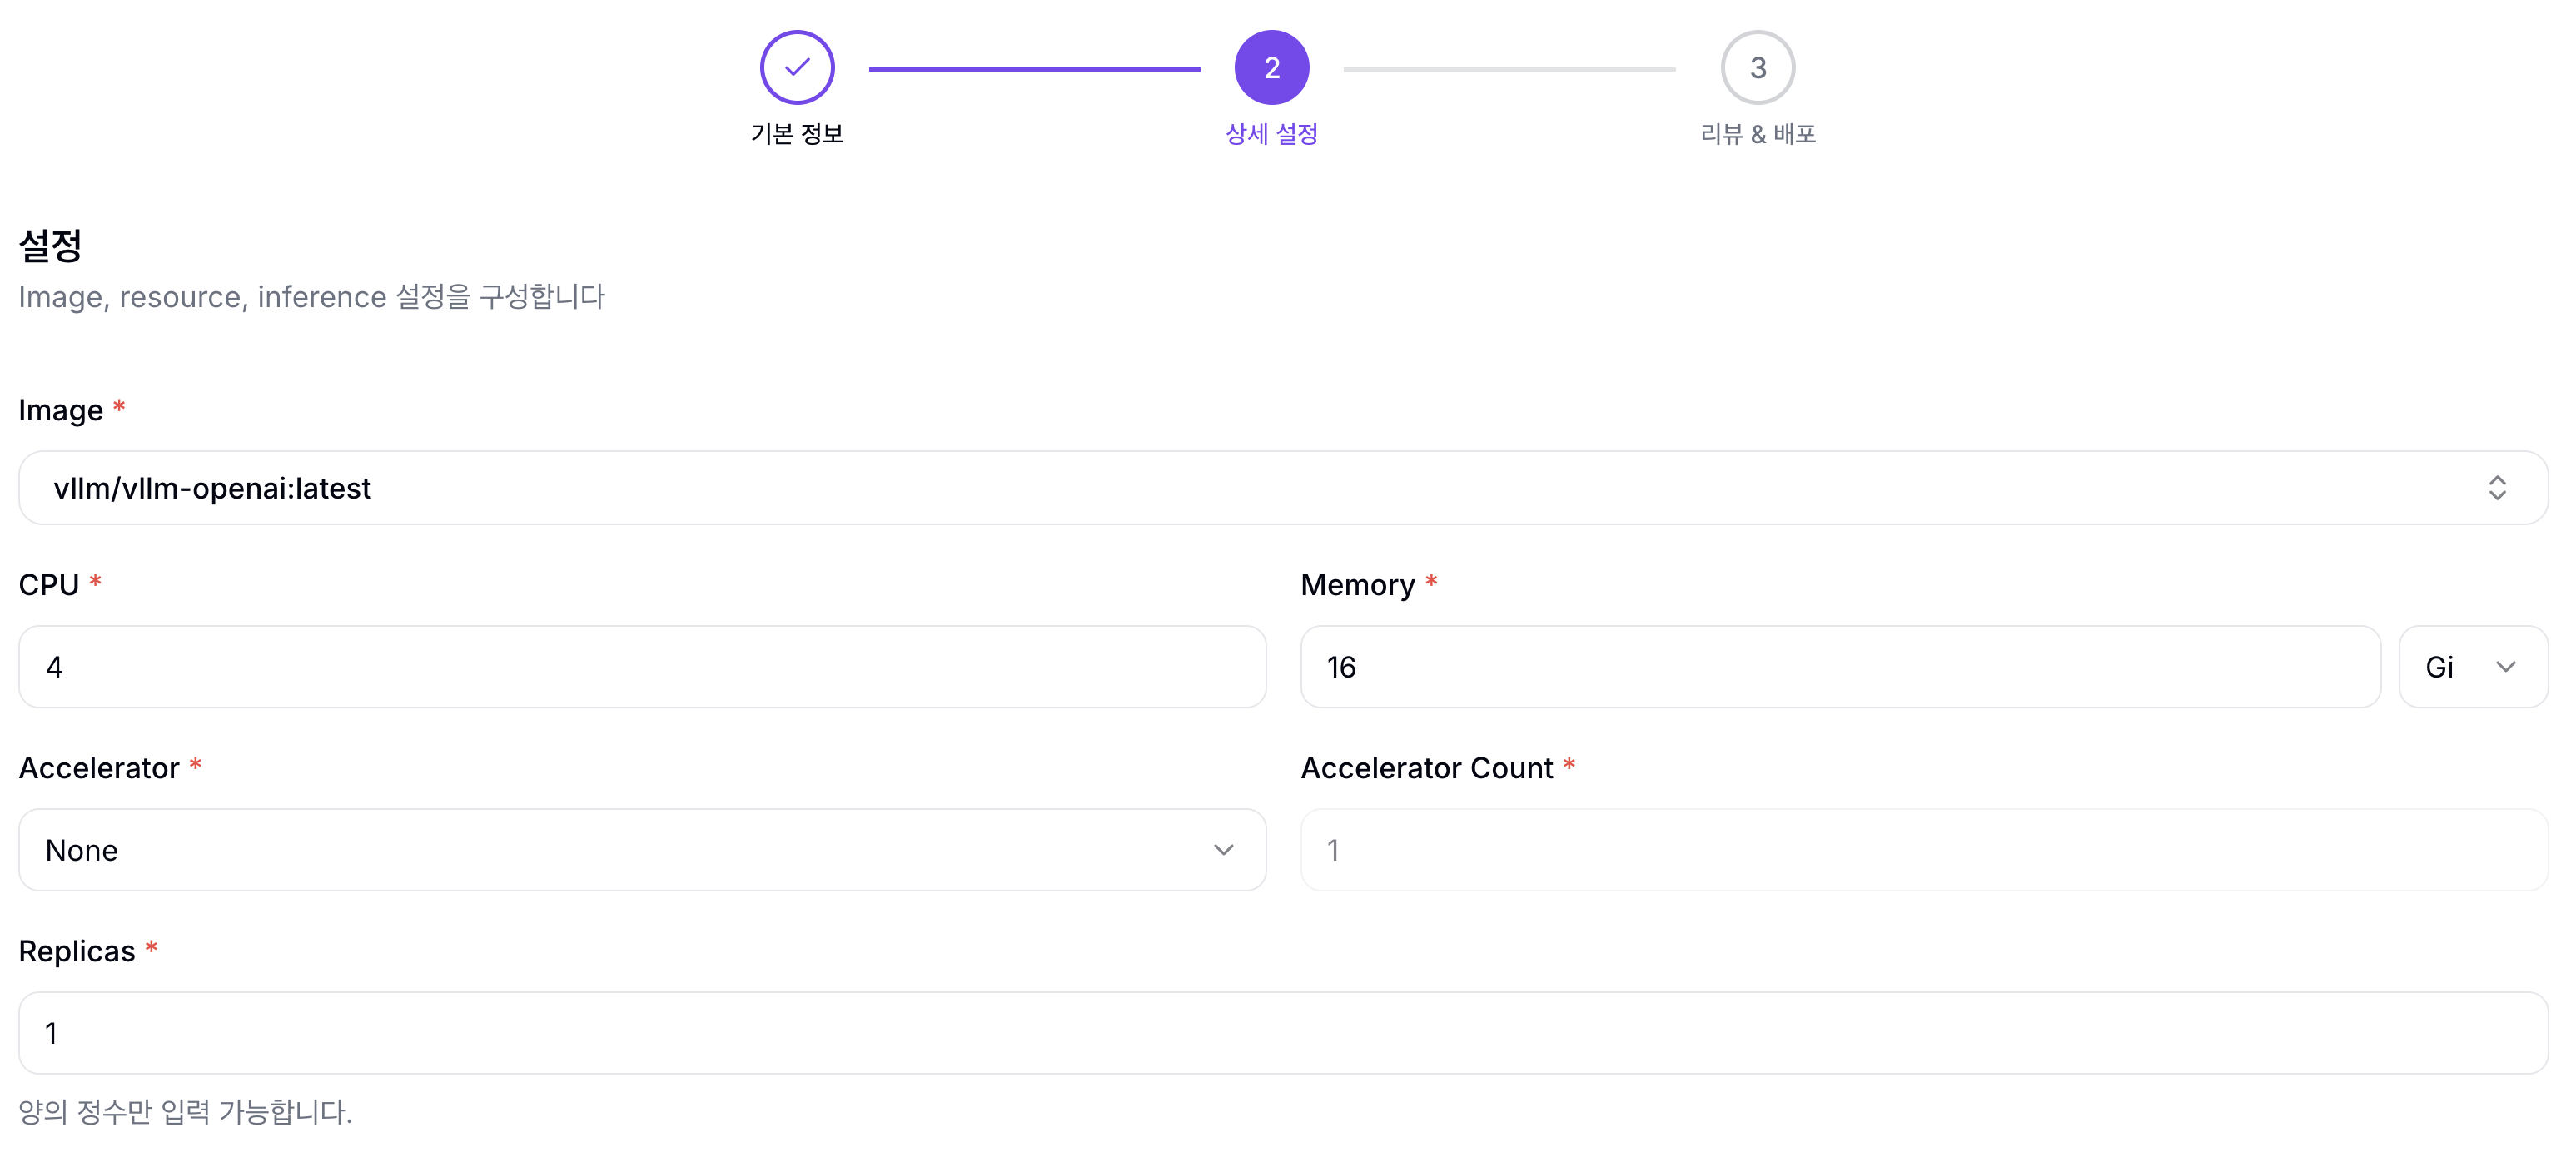
| Field | Description | Default (Custom) | Default (vLLM) |
|---|---|---|---|
| Image | Container image | - | vLLM image |
| CPU | Number of CPU cores | 0.5 | 4 |
| Memory | Memory | 1Gi | 16Gi |
| Accelerator | Accelerator type | None | NVIDIA GPU |
| Accelerator Count | Number of accelerators | 1 | 1 |
| Replicas | Number of service containers | 1 | 1 |
The common-setting defaults are pre-filled based on the template selected in Step 1.
Supported Accelerators
| Accelerator | Resource Key | Available Features |
|---|---|---|
| NVIDIA GPU | nvidia.com/gpu | Lab, Serving |
| Furiosa RNGD | furiosa.ai/rngd | Lab, Serving |
Per-template additional settings:
- vLLM
- Custom
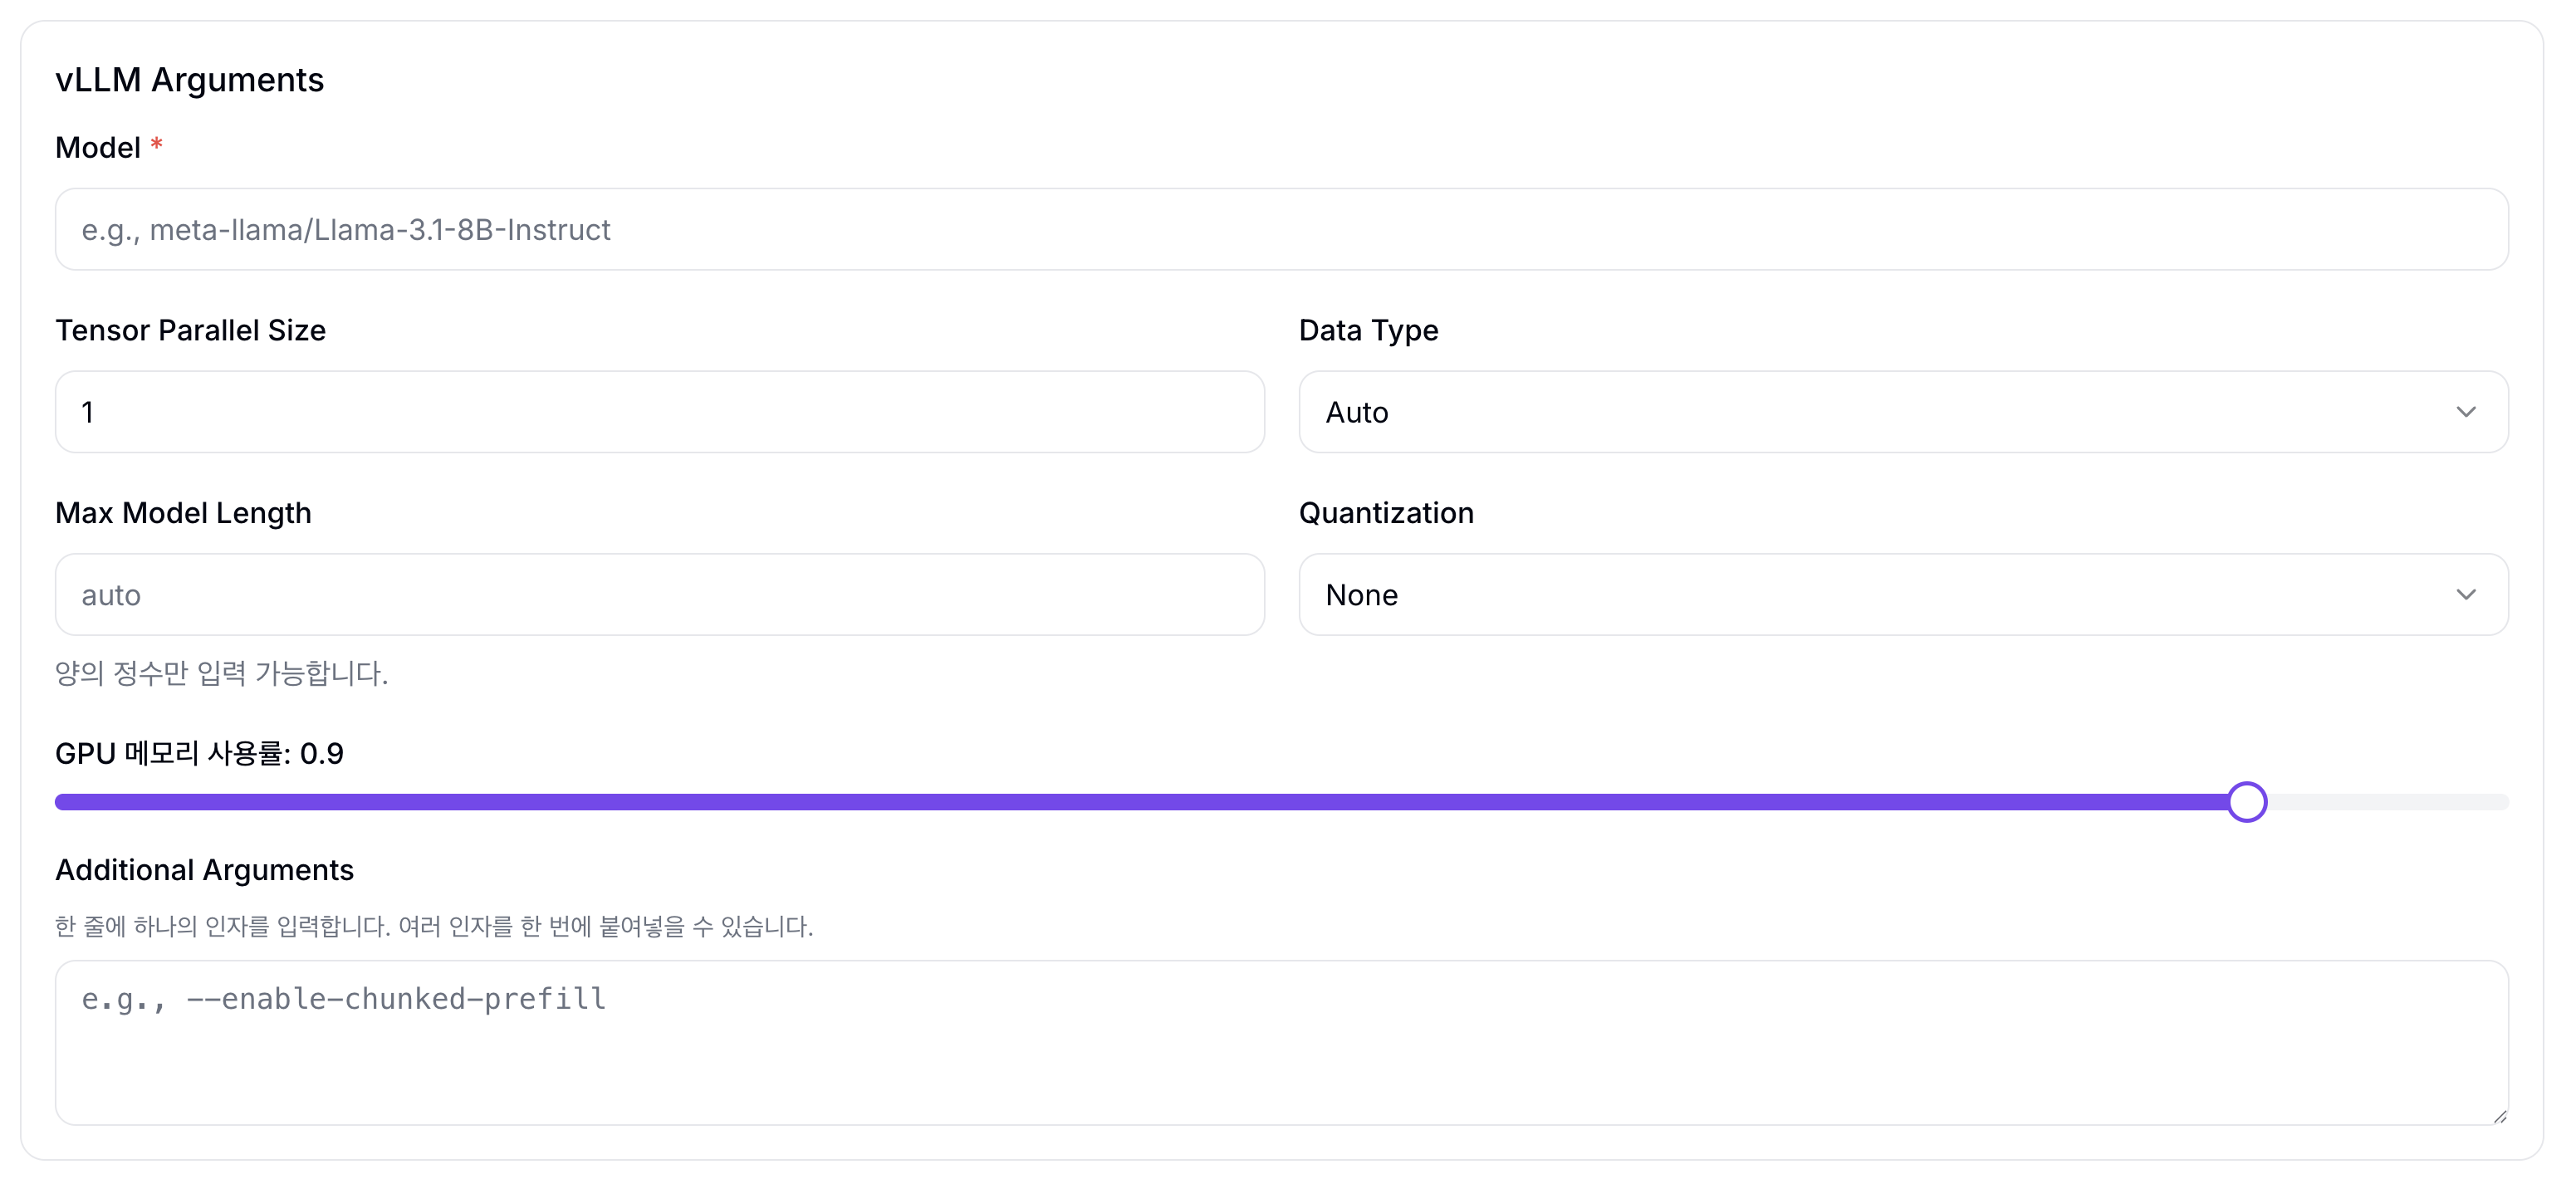
| Field | Description | Default |
|---|---|---|
| Model | Model name or path (e.g., meta-llama/Llama-3.1-8B-Instruct) | - |
| Tensor Parallel Size | Number of GPUs to split the model across | 1 |
| Data Type | Numeric representation for model operations | Auto |
| Max Model Length | Maximum tokens processed (input + output combined) | - |
| Quantization | Reduce model precision to save memory | - |
| GPU Memory Utilization | Fraction of GPU memory vLLM will use (0.0–1.0) | 0.9 |
| Additional Arguments | Enter advanced vLLM settings directly | - |
For vLLM options accepted by Additional Arguments, see the official vLLM vllm serve CLI arguments.
The Custom template uses only the common settings (Image, CPU, Memory, Accelerator, Replicas) and Advanced Settings. You control it directly via the container image and Command Override.
Data Volumes (optional):
Use Data Volumes to mount an existing Volume (PVC) into the Serving container. Hardcoded volumes (model-cache, dshm) are shown as read-only system defaults; users can additionally specify PVCs they created. For Volume creation and management, see Volumes.
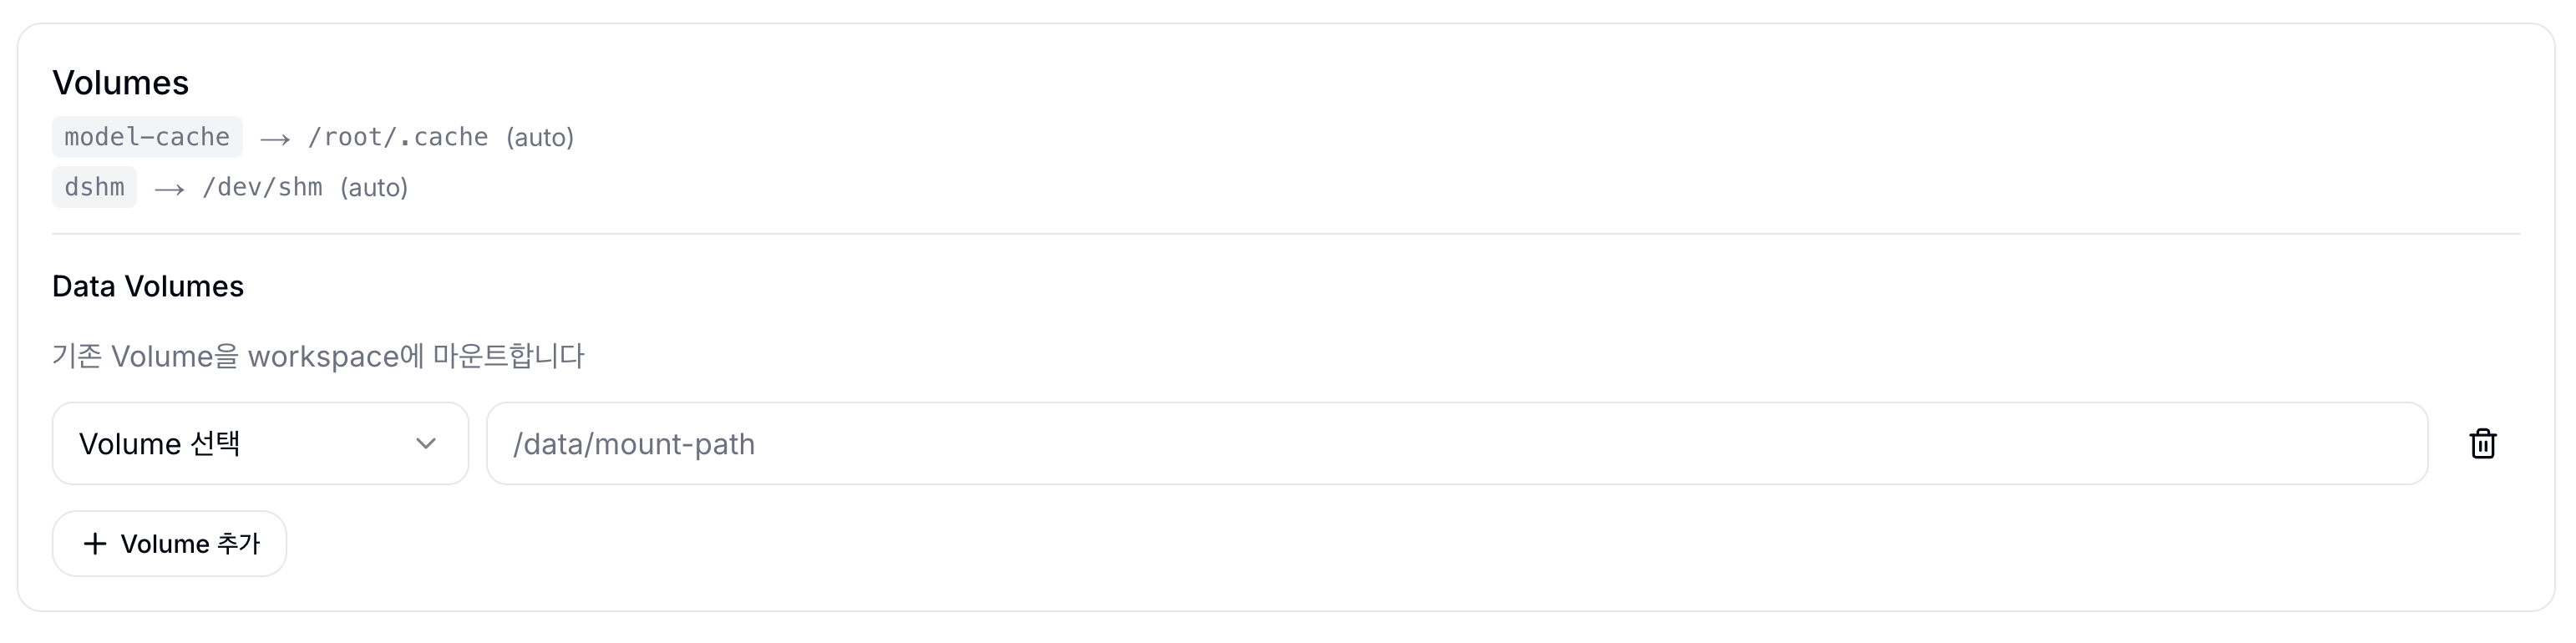
You can mount additional user PVCs via the + Add Volume button.
| Field | Description |
|---|---|
| Volume | Select a Volume in the current project. The same Volume can be selected only once. |
| Mount Path | Path where the Volume appears inside the container. The default is /data/<volume-name>; use this path in container commands and model path settings. |
Advanced Settings (optional):
| Field | Description | Default |
|---|---|---|
| Inference Port | Service inference port | 8000 |
| Command Override | Container start command | - |
| Environment Variables | Environment variables (KEY=VALUE or env file) | - |
| Transformer | Add a pre/post-processing sidecar | - |
Use Transformer when you need pre-processing or post-processing. When enabled, NuFi adds a sidecar container to the same Pod, and nufi-proxy calls that container's /transform endpoint.
| Input | What to enter | Purpose |
|---|---|---|
| Preprocessor | Request pre-processing container image and port (default 8081) | Convert client requests into the format expected by the inference server |
| Postprocessor | Response post-processing container image and port (default 8082) | Convert inference server responses into the format expected by the client |
Turn on only the Preprocessor or Postprocessor you need, then enter the container image to run and the port where that container listens.
The request flow is:
- The client sends a request to the Serving endpoint.
- nufi-proxy sends the request details to the Preprocessor
/transformendpoint. - The Preprocessor returns the transformed body and does not call the inference server directly.
- nufi-proxy forwards the transformed body to the inference server.
- If the Postprocessor is enabled, the inference response is transformed the same way before it is returned to the client.
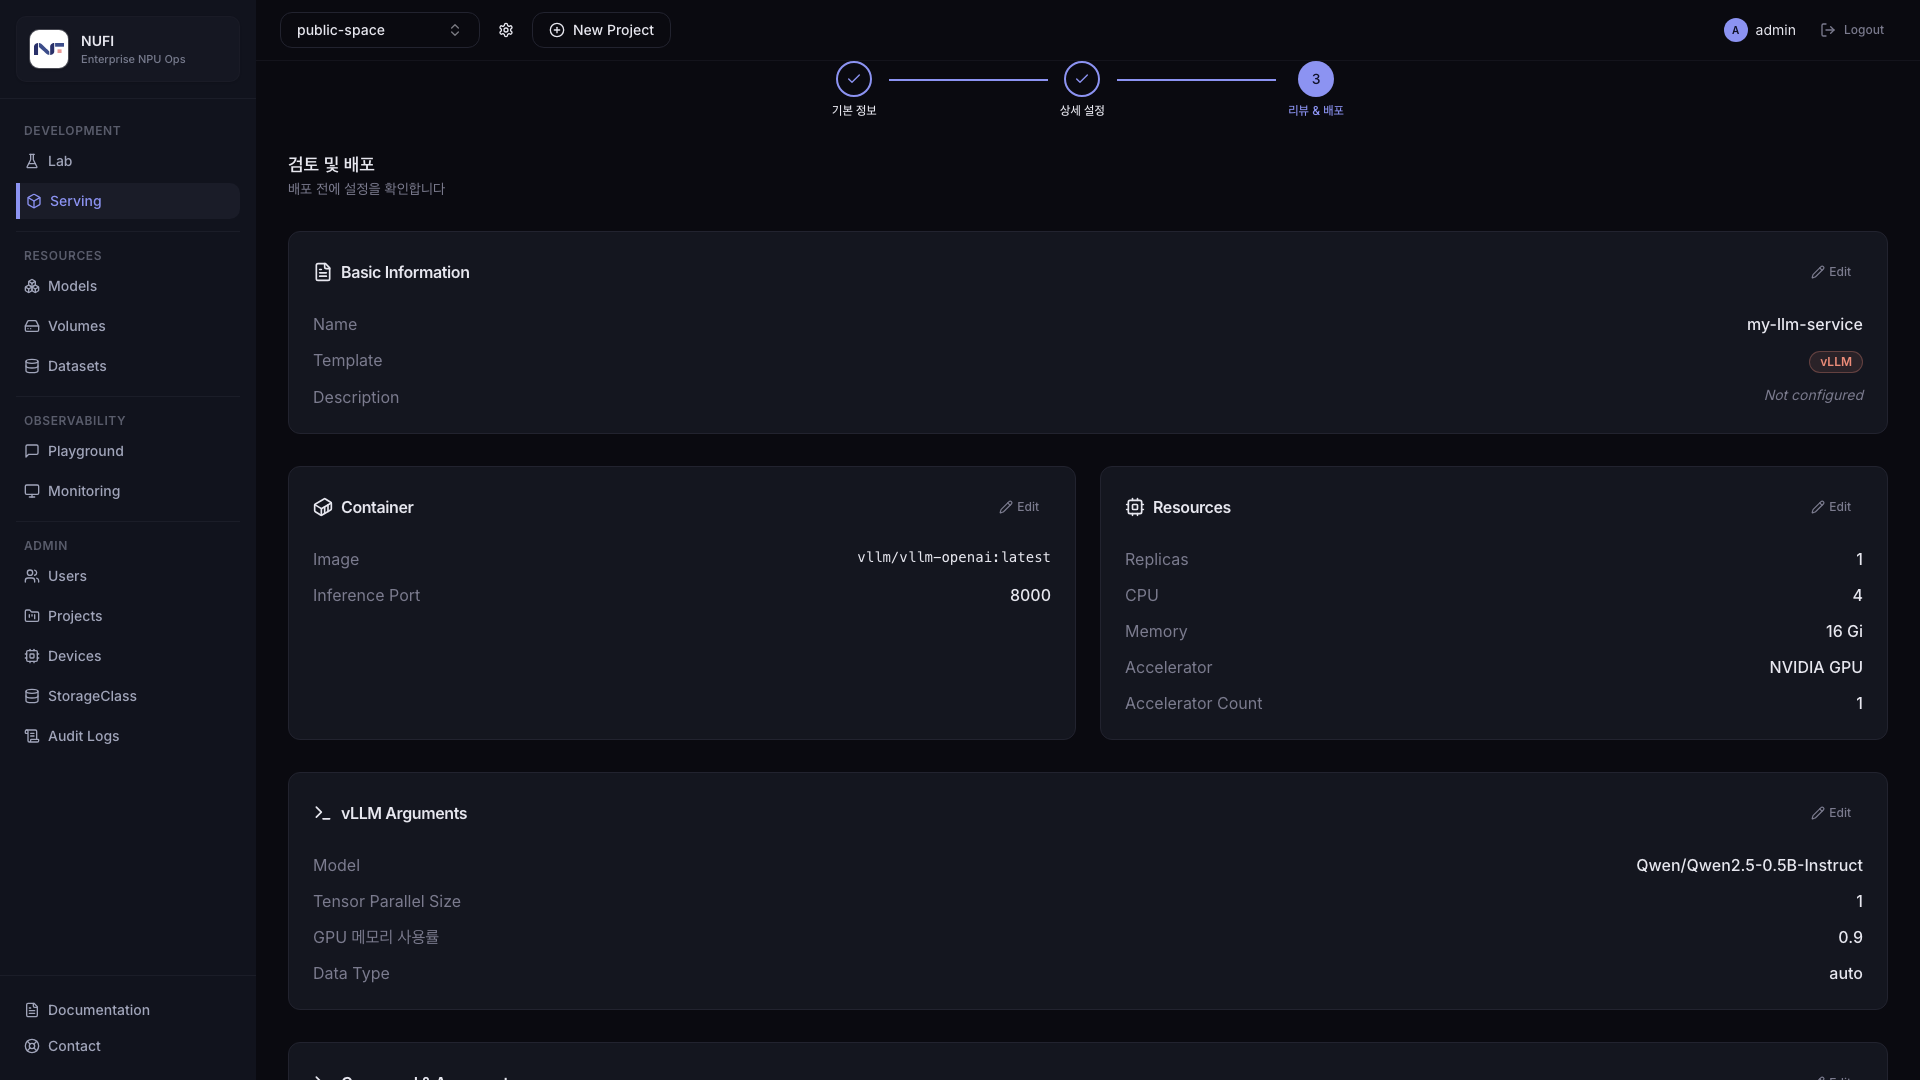
If any spec needs to be changed, click the Edit button. Click the Deploy button at the bottom right to deploy.
Serving Detail Page
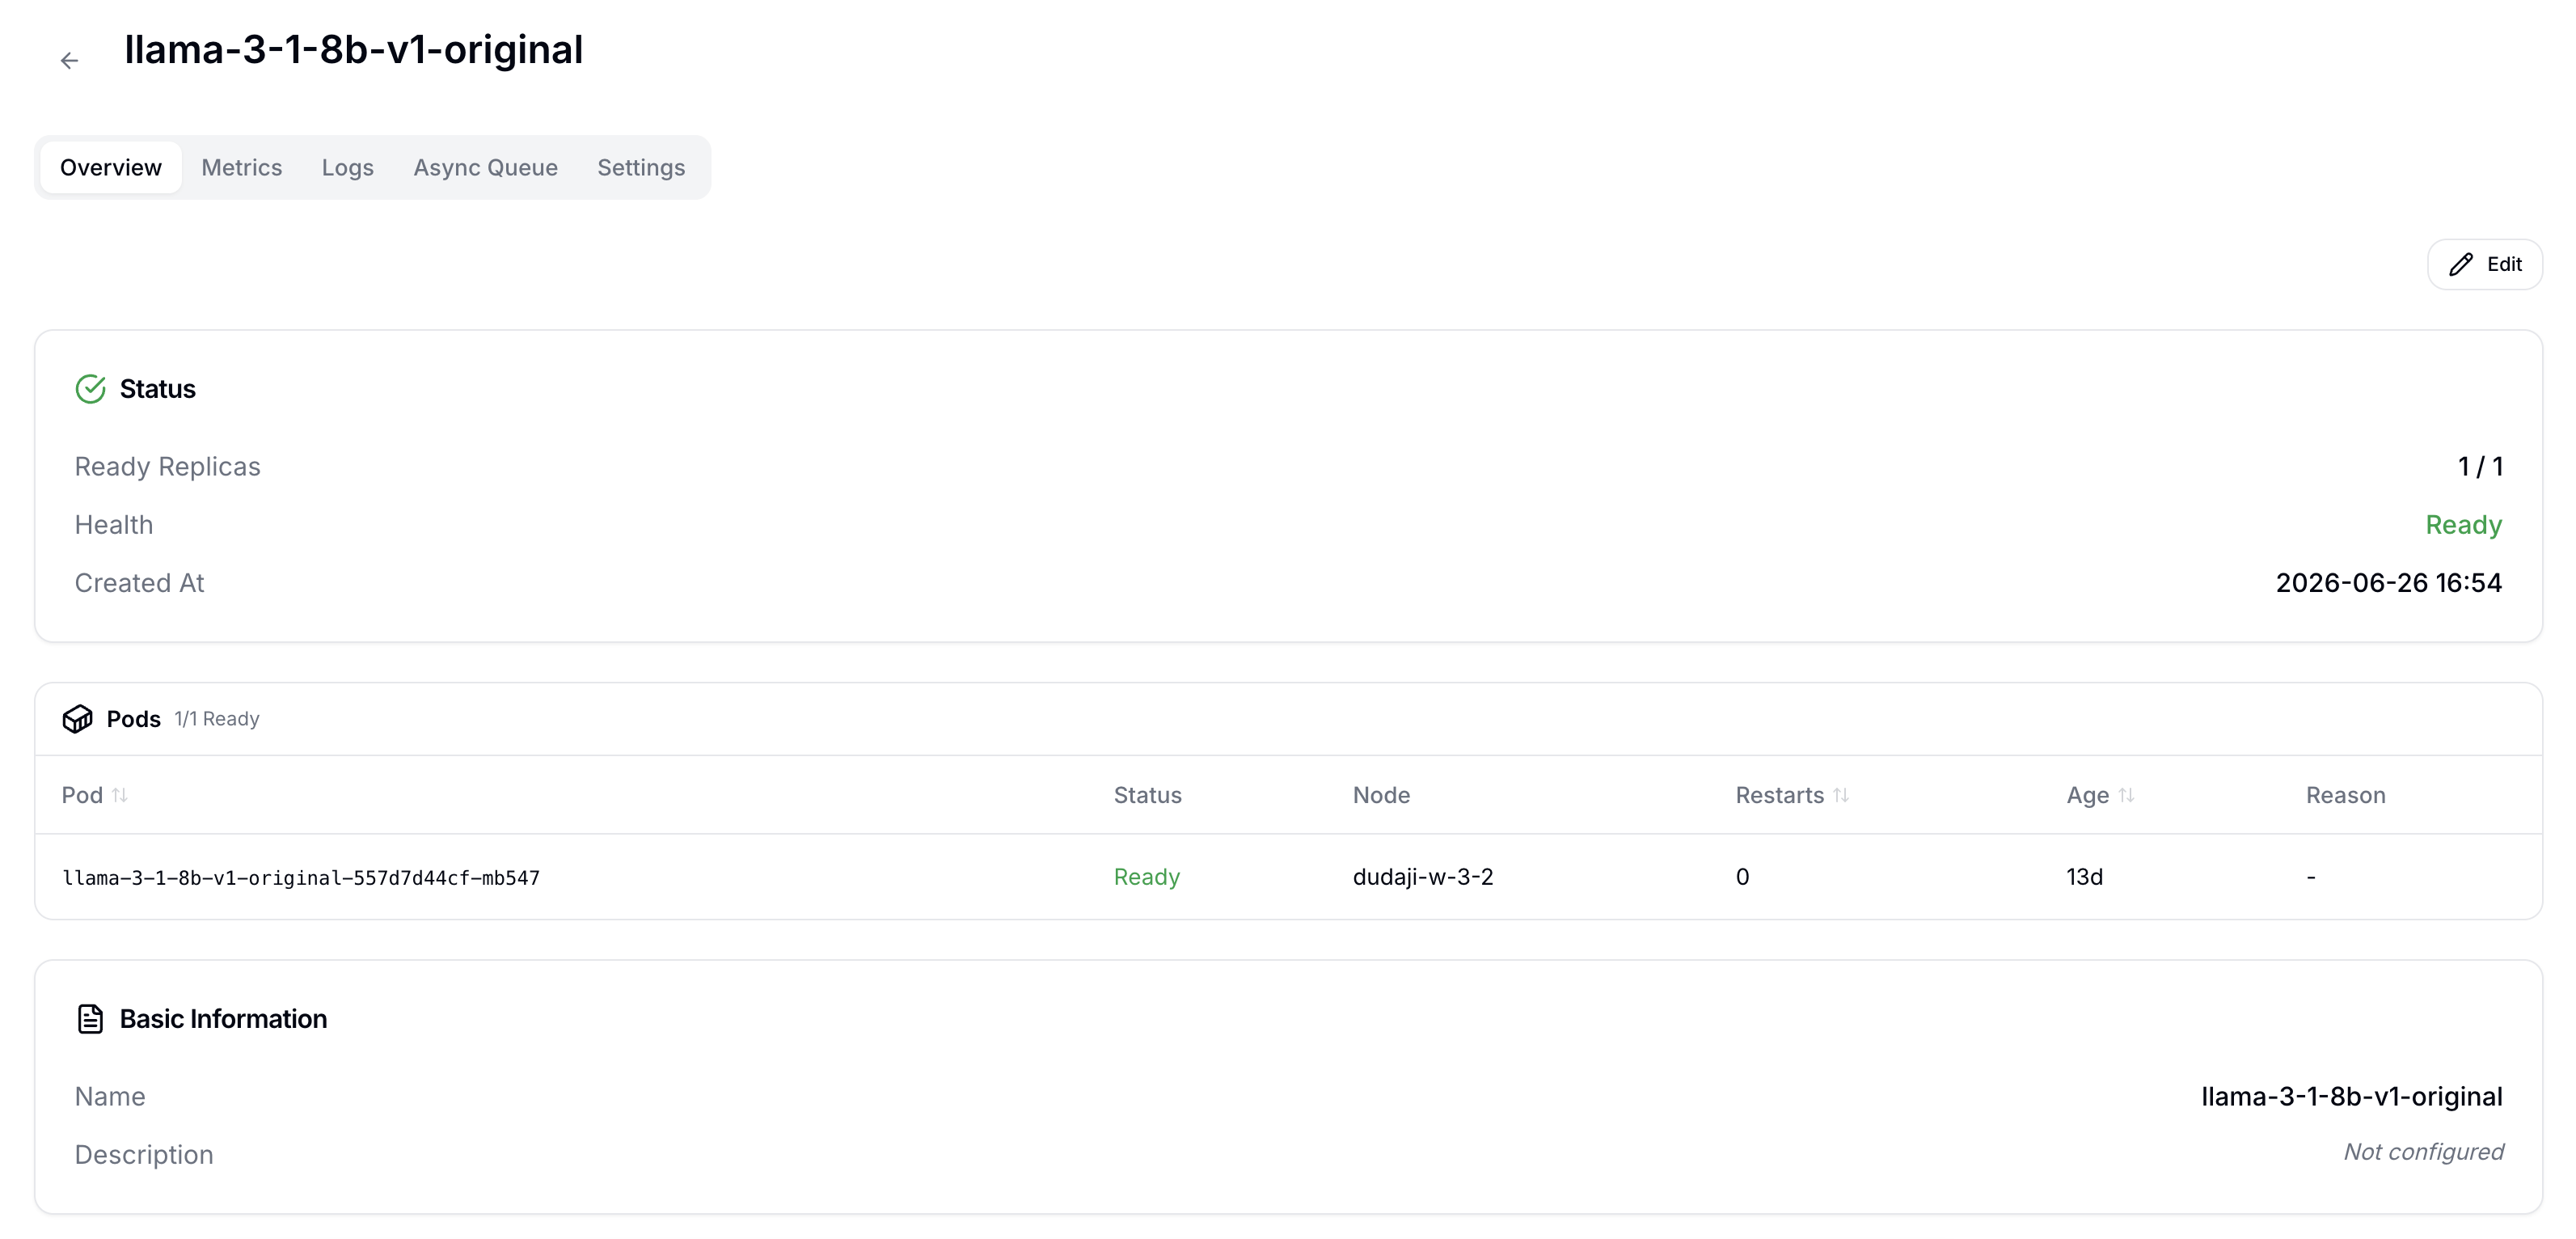
Click an item in the Serving list to go to its detail page. Click the Edit button at the top right of the Overview tab to switch into edit mode; after changes, click the Save Changes button in the Floating Save Bar at the bottom of the screen to apply. If changes that require a Pod restart (image, port, resources, volumes, etc.) are included, a confirmation dialog is shown.
- Overview
- Metrics
- Logs
- Async Queue
- Settings
Card Layout
The Overview tab is where you check whether a Serving can currently receive requests and review or edit the deployment spec entered at creation time.
| Card | Description |
|---|---|
| Status | Overall Serving status summary |
| Pods | Per-Pod status table — failing Pods sorted first |
| Basic Information | Serving name and description |
| Container | Inference server image and port |
| Resources | CPU, Memory, Accelerator, Replicas |
| Command & Arguments | Container start command and runtime arguments |
| Environment Variables | Container environment variables |
| Volumes | PVC mounts and mount paths |
| Transformer | Pre/post-processing sidecar settings |
Status
Status is the first place to check the current operating state of the Serving. Ready Replicas shows the number of ready Pods and desired Pods in ready / desired format. When the two numbers match, all replicas are ready to receive requests. Health summarizes the Serving state as Ready, Starting, Degraded, Error, Pending, or Scaled Down.
If Auto Scaling is enabled, the minimum and maximum Replica range is shown as well. This means the number of running Pods can change automatically, so check the scaling policy in the Settings tab for the actual scaling behavior. Created At shows when the Serving was created.
Pods
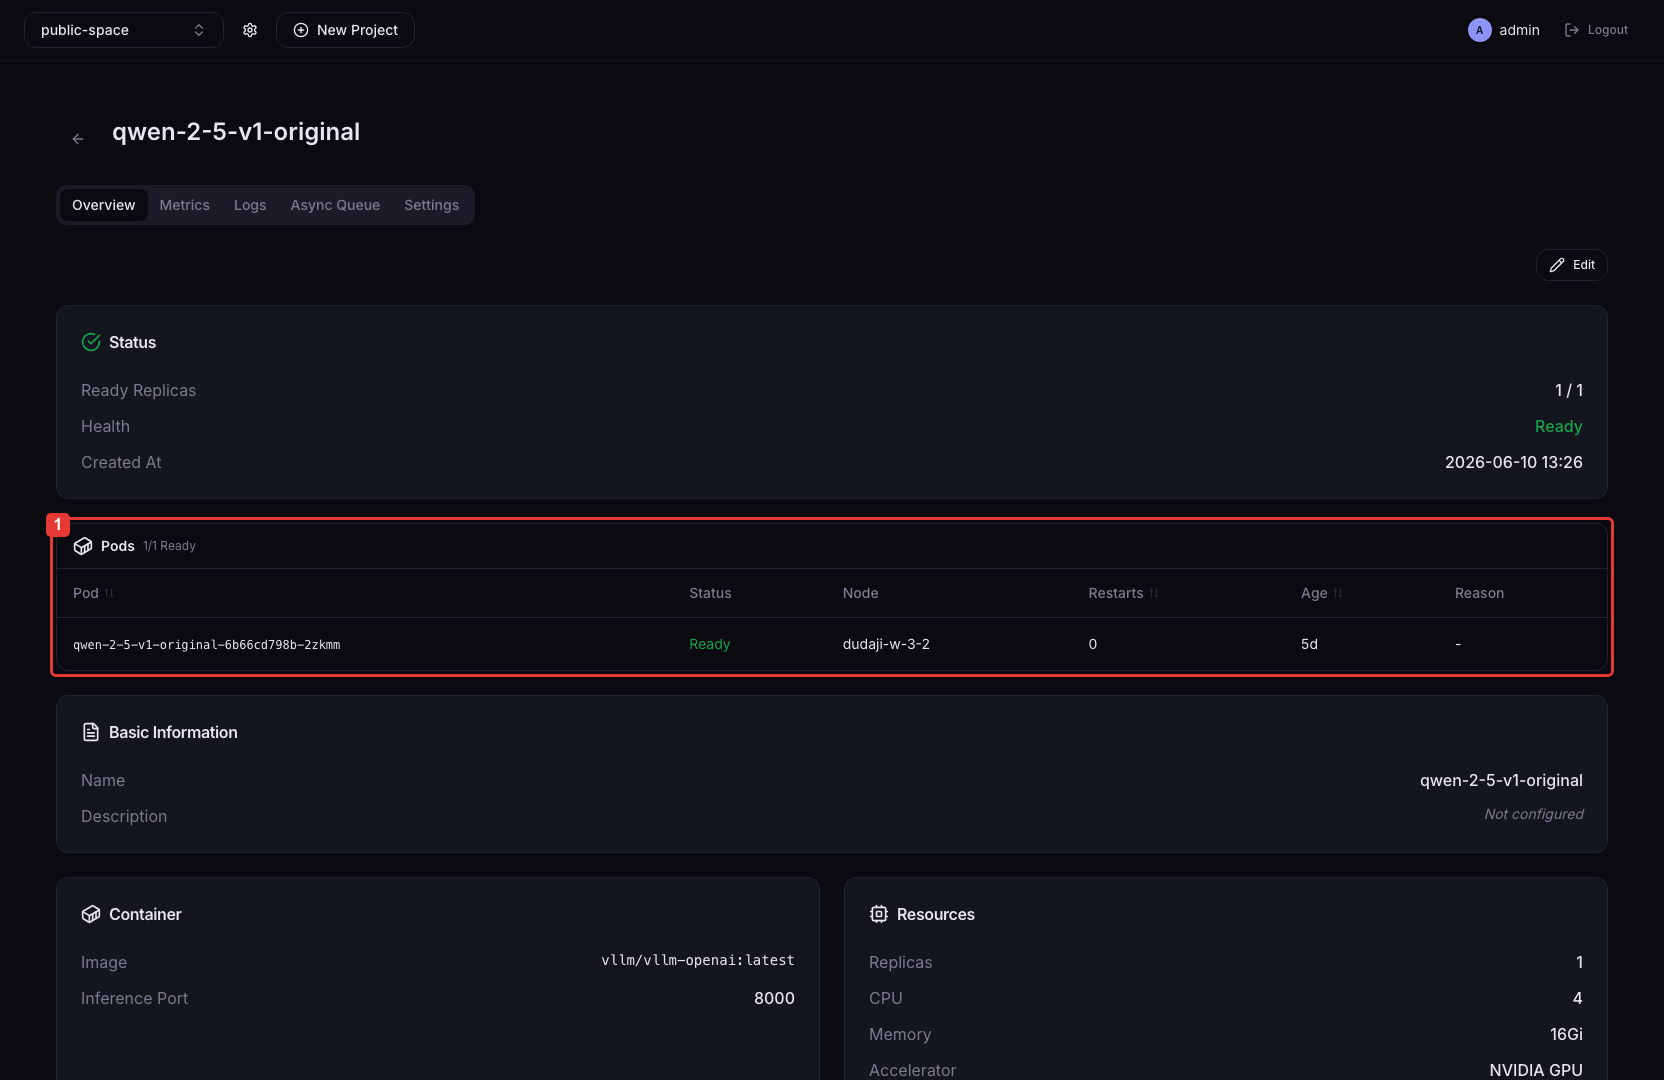
A Serving runs as one or more Kubernetes Pods. The Pods section shows where each Pod is running, whether it is ready, and whether it is repeatedly restarting. If Status is Starting, Degraded, Error, or Pending instead of Ready, use this section first to identify which Pod is causing the problem.
Failing Pods are sorted to the top of the table. Reason shows why a Pod is Ready=false or in an error state, and View logs opens the Logs tab for that Pod so you can inspect the inference server logs.
| Column | Description |
|---|---|
| Status | Current status of the Pod (Running / Pending / CrashLoopBackOff, etc.) |
| Node | Name of the node the Pod is scheduled on |
| Restarts | Container restart count |
| Age | Time since the Pod was created |
| Reason | Failure reason shown when Ready=false or on error |
| View logs | Log link shown for Pods where Ready=false or restartCount > 0. Opens a new tab to the Logs tab of that Pod. |
Basic Information
Basic Information shows the Serving name and description. Name cannot be changed after creation, while Description can be updated in edit mode.
Container
Container shows the settings for the container that runs the inference server. Image is the vLLM or Custom server image, and Inference Port is the port where the inference server listens inside the container.
External requests opened from the Connect button are routed to this Serving, then forwarded internally to the Inference Port. Changing the image or port and saving the change restarts the Pod.
Resources
Resources shows the compute resources requested by each Serving Pod and the number of Pods to run. CPU and Memory are the base resources assigned to the container, while Accelerator and Accelerator Count identify the GPU/NPU type and count. Replicas is the number of Serving Pods to run.
If the requested resources are larger than the available cluster capacity, Pods can stay Pending. Increasing Replicas can increase throughput, but it also requires additional CPU, Memory, and Accelerator capacity.
Command & Arguments
Command & Arguments shows the command and arguments used when the container starts. For a Serving created from the vLLM template, values such as model, dtype, tensor parallel size, and additional arguments are reflected in the runtime arguments. For the Custom template, the configured Command Override and Arguments are used directly.
If the model path, port, or runtime option is wrong, the Pod may start but the inference server may fail to become ready. When Status or Pods shows an error, check these runtime arguments together with the logs.
Environment Variables
Environment Variables are KEY=VALUE settings injected into the container. Use them for values that should not be baked into the image, such as API URLs, tokens, model server options, or framework settings.
In edit mode, you can add, update, or remove environment variables. Before changing a value, confirm that the container command or application actually reads that variable.
Volumes
Volumes shows the PVCs mounted into the Serving Pod and their mount paths. You can distinguish NuFi-provided system volumes (model-cache, dshm) from user-added Data Volumes.
If model files, LoRA adapters, config files, or data files are stored in a PVC and read by the container, the mount path shown here must match the path referenced by Command & Arguments or environment variables. Changing volume configuration may require a Pod restart.
Transformer
Transformer configures optional sidecars for request preprocessing or response postprocessing. When Preprocessor is enabled, requests can pass through a separate container before reaching the inference server. When Postprocessor is enabled, inference responses can pass through a separate container before leaving the Serving.
If Transformer is disabled, inference requests go directly to the main inference server container. If it is enabled, sidecar image, port, and environment variables also affect Serving behavior, so review them together with the Container settings.
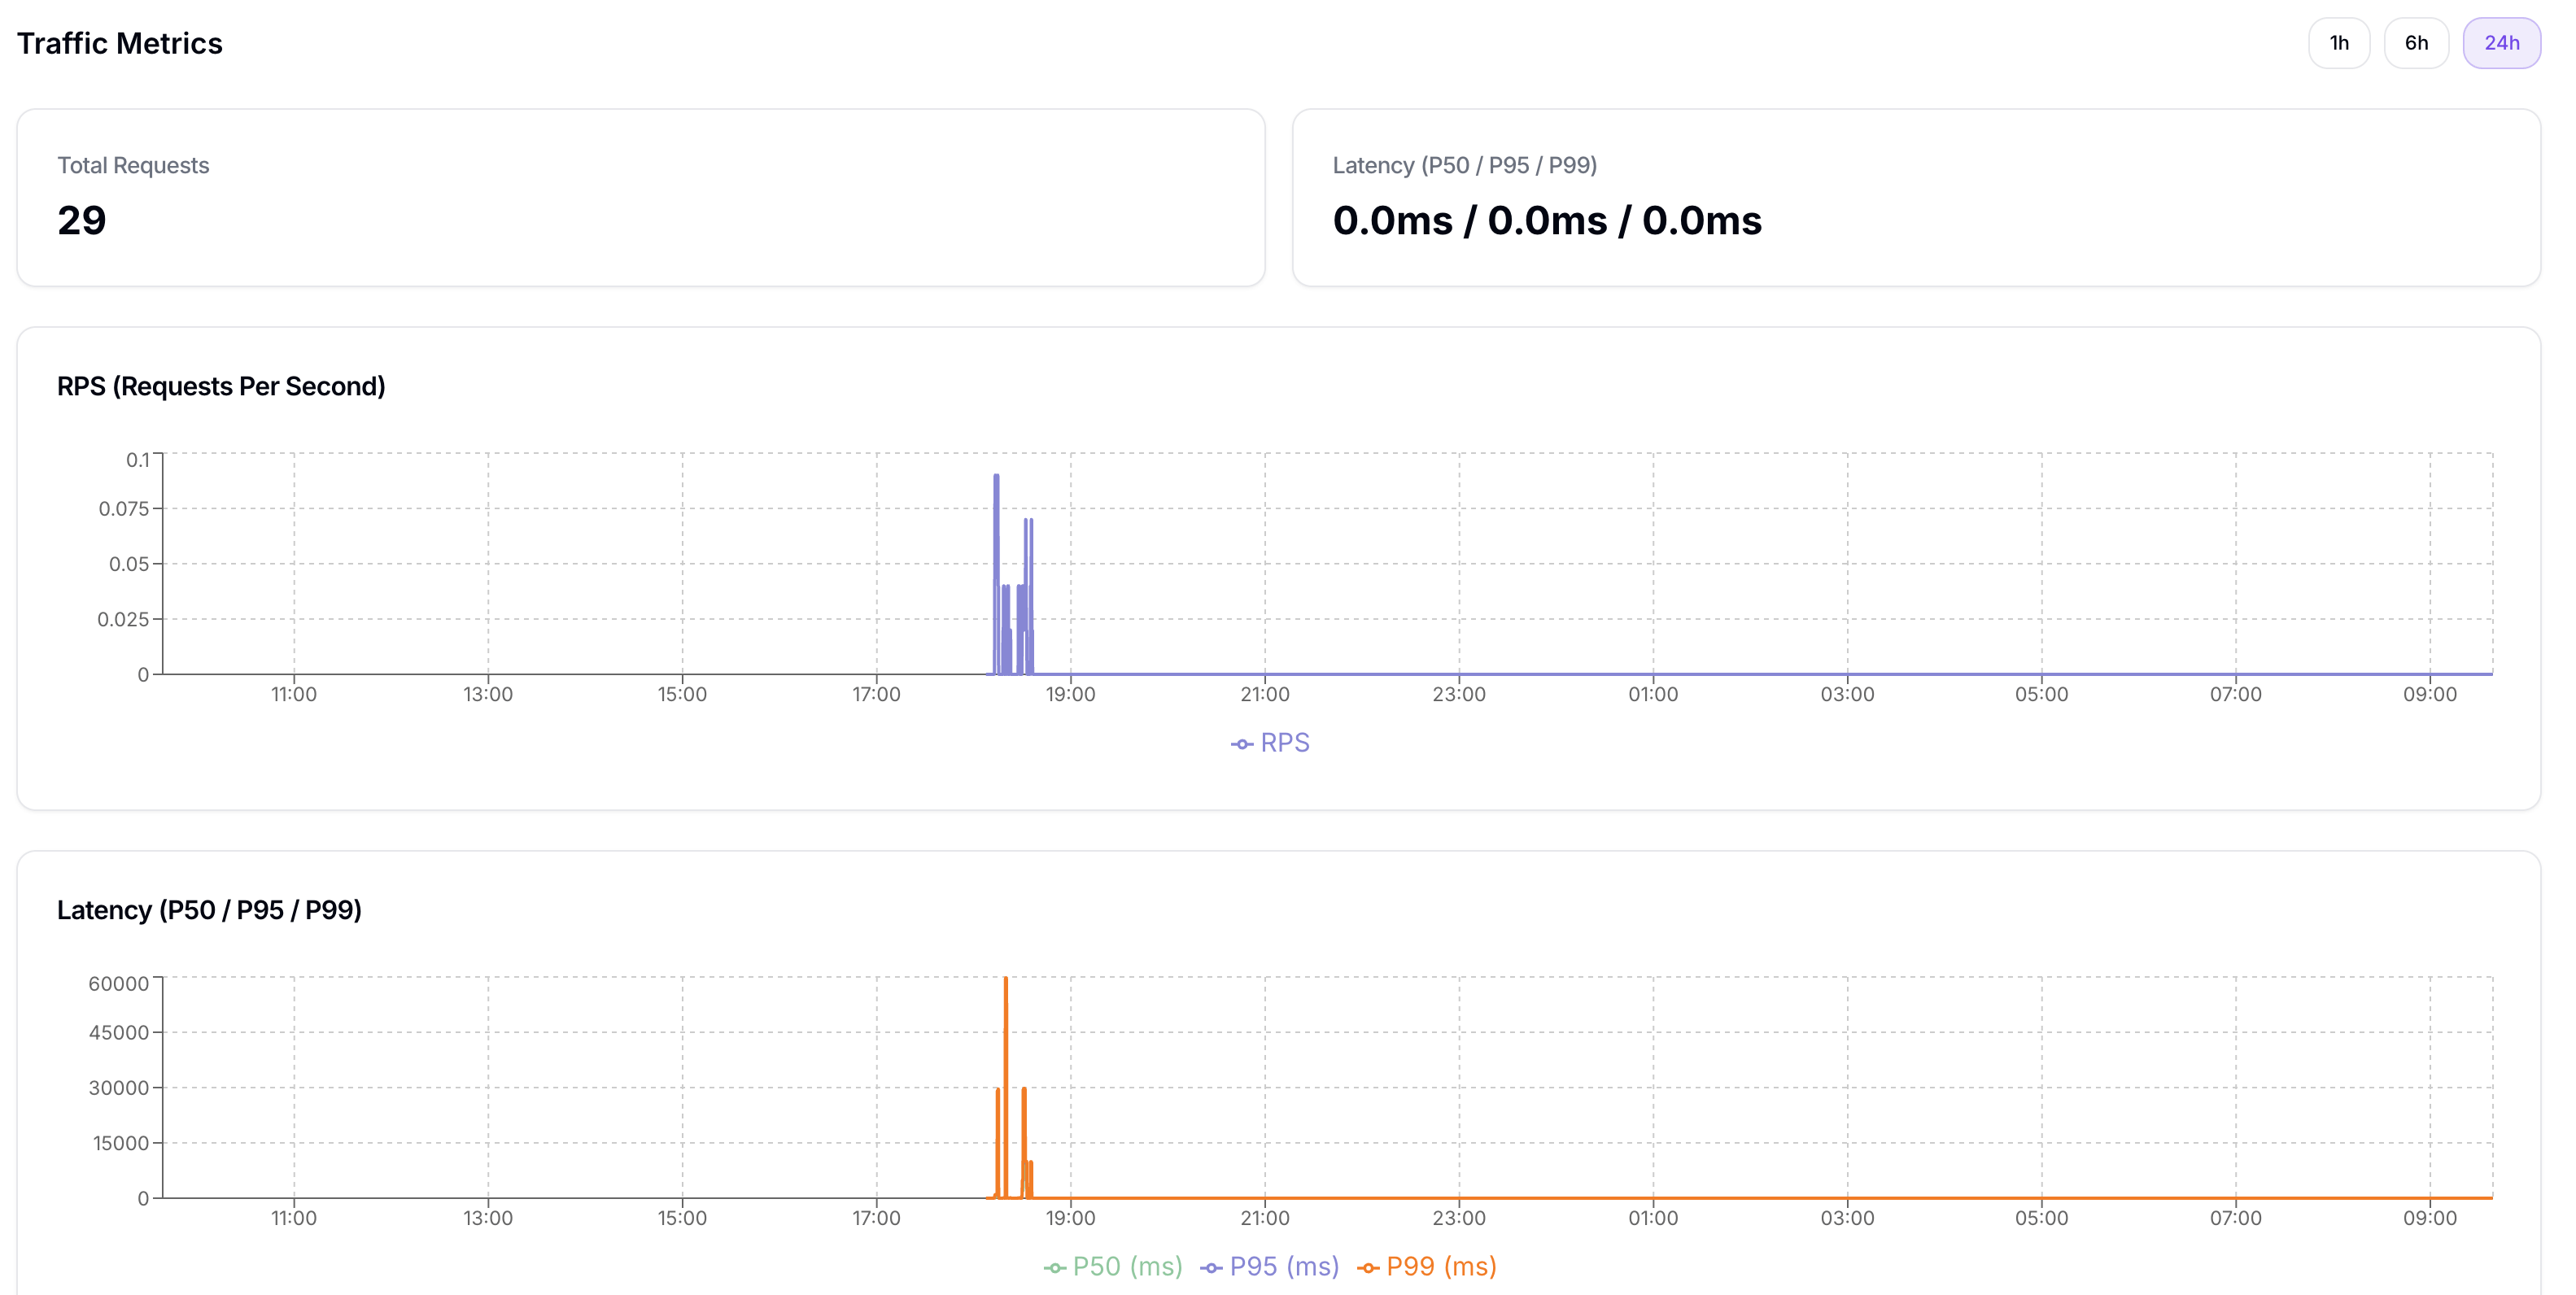
Use the time range buttons (1h / 6h / 24h) at the top right to adjust the graph period.
| Card | Information |
|---|---|
| Total Requests | Total request count |
| Latency (P50 / P95 / P99) | Current request response times |
| RPS graph | Time series of requests per second |
| Latency graph | Time series of P50/P95/P99 response times |
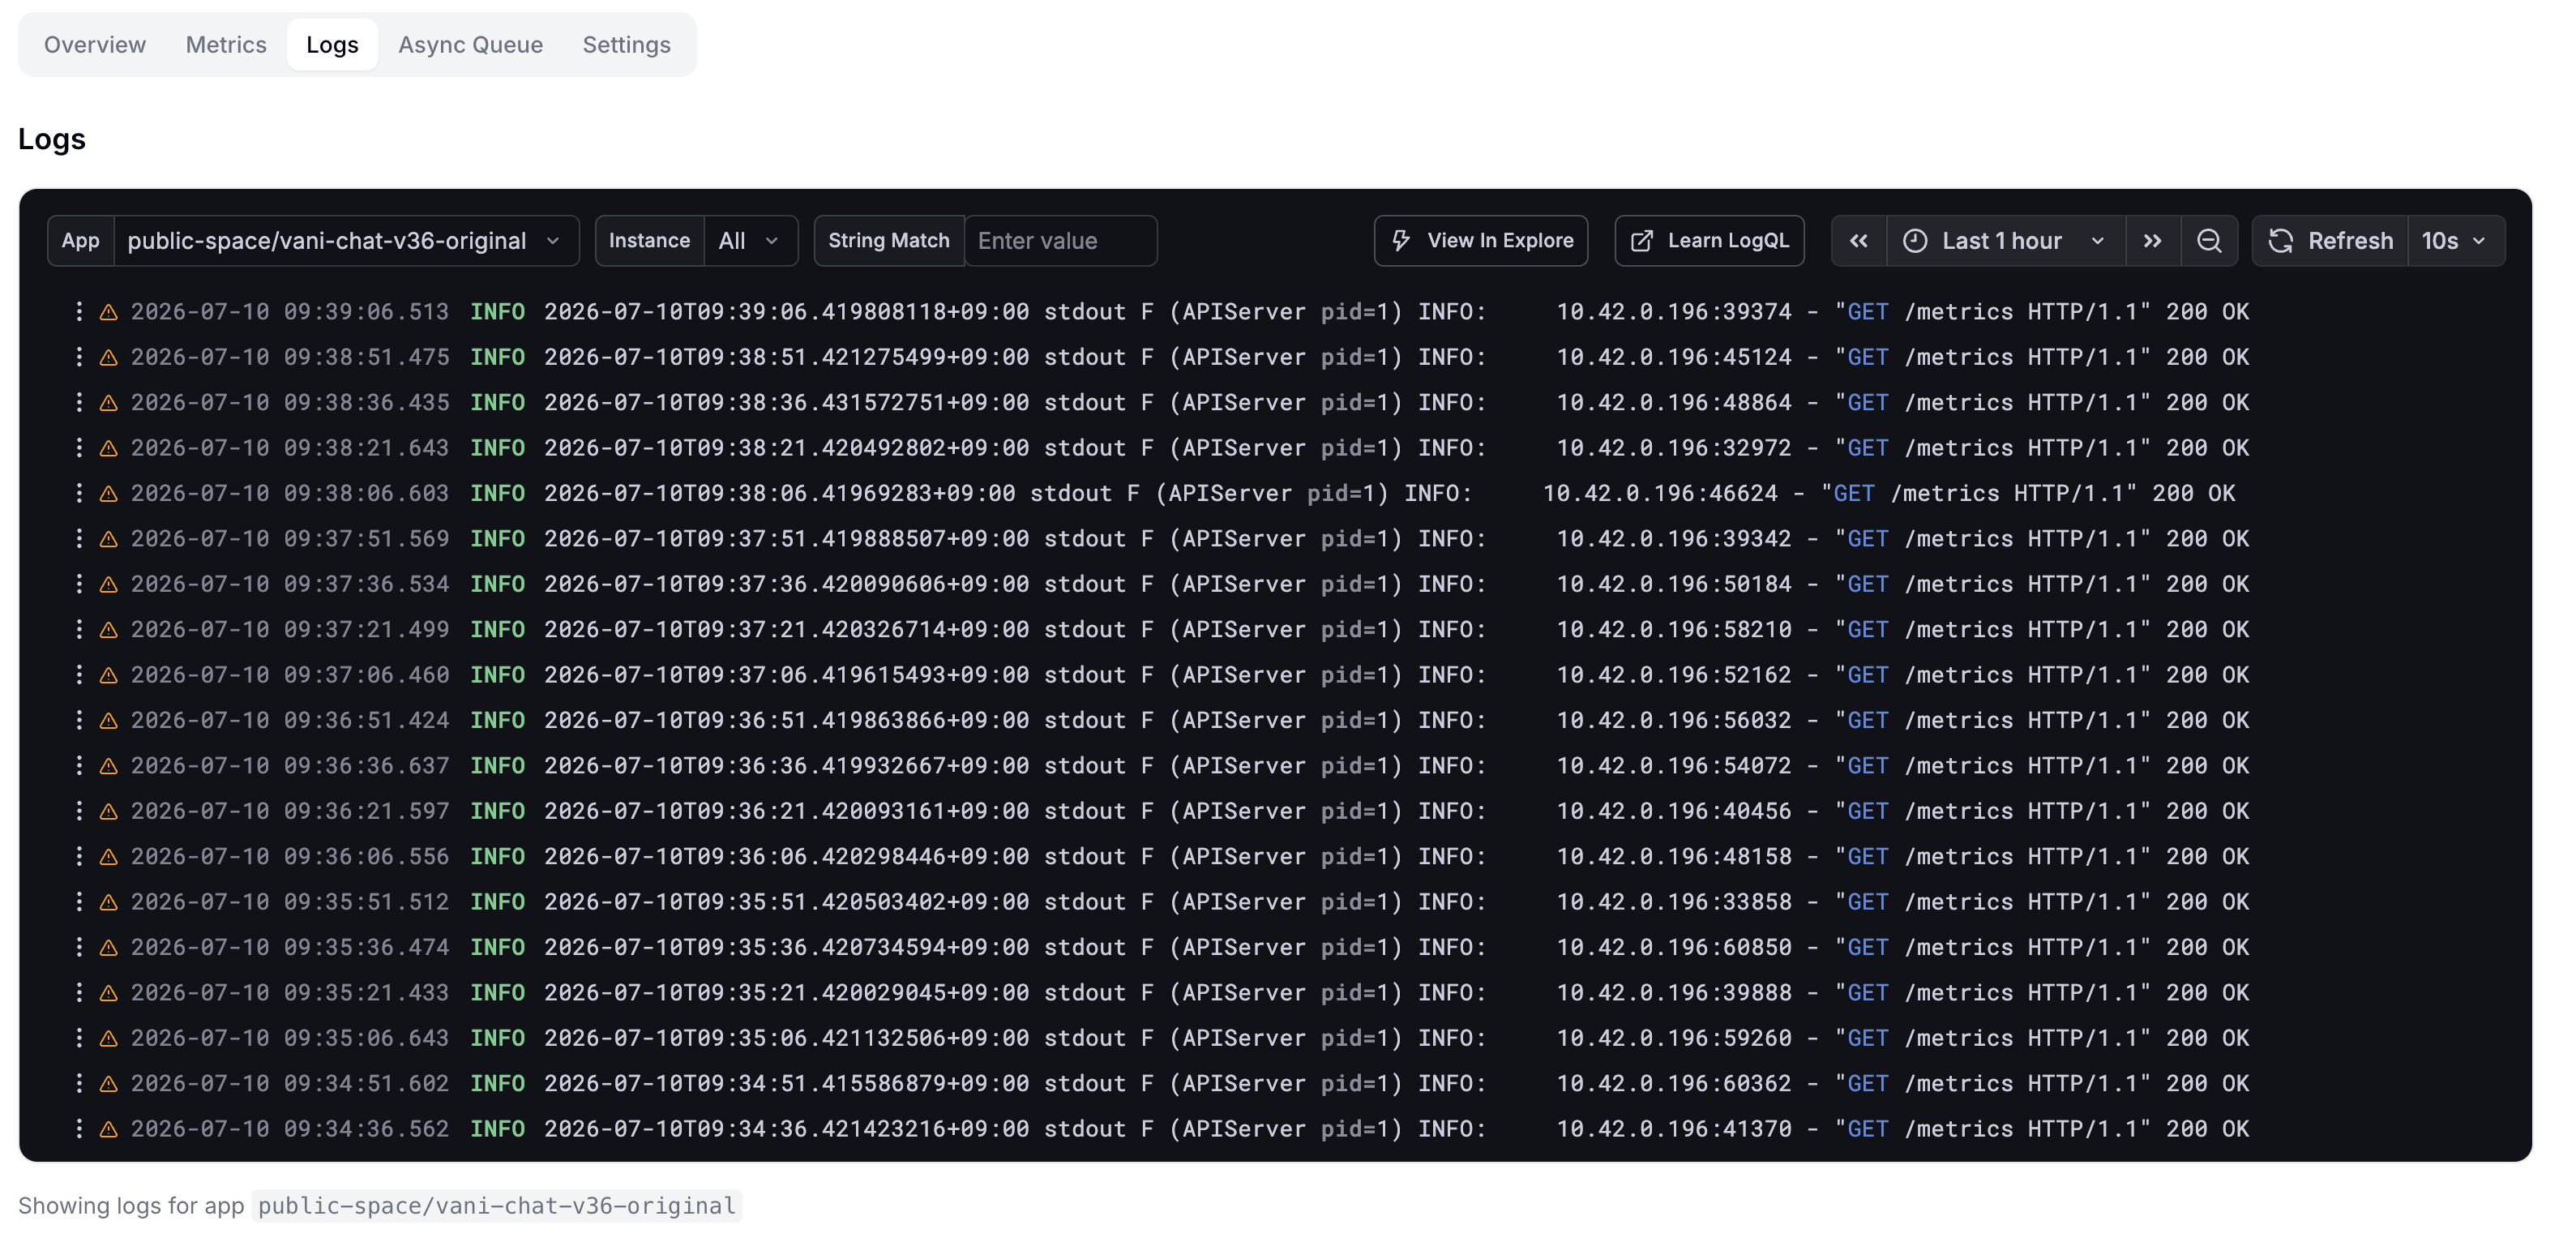
Prints the runtime logs of the inference server container. The Logs tab selects the current Serving's App and Instance as the default log target.
| Item | Description |
|---|---|
| String Match | Narrows results to log lines that contain the entered string. Leave it empty to show all logs without a string filter. |
| Time range / refresh | Use the controls at the top right to adjust the query period and automatic refresh interval. |
When you enable Async Queue in Settings, you can browse the asynchronous request list and the results.
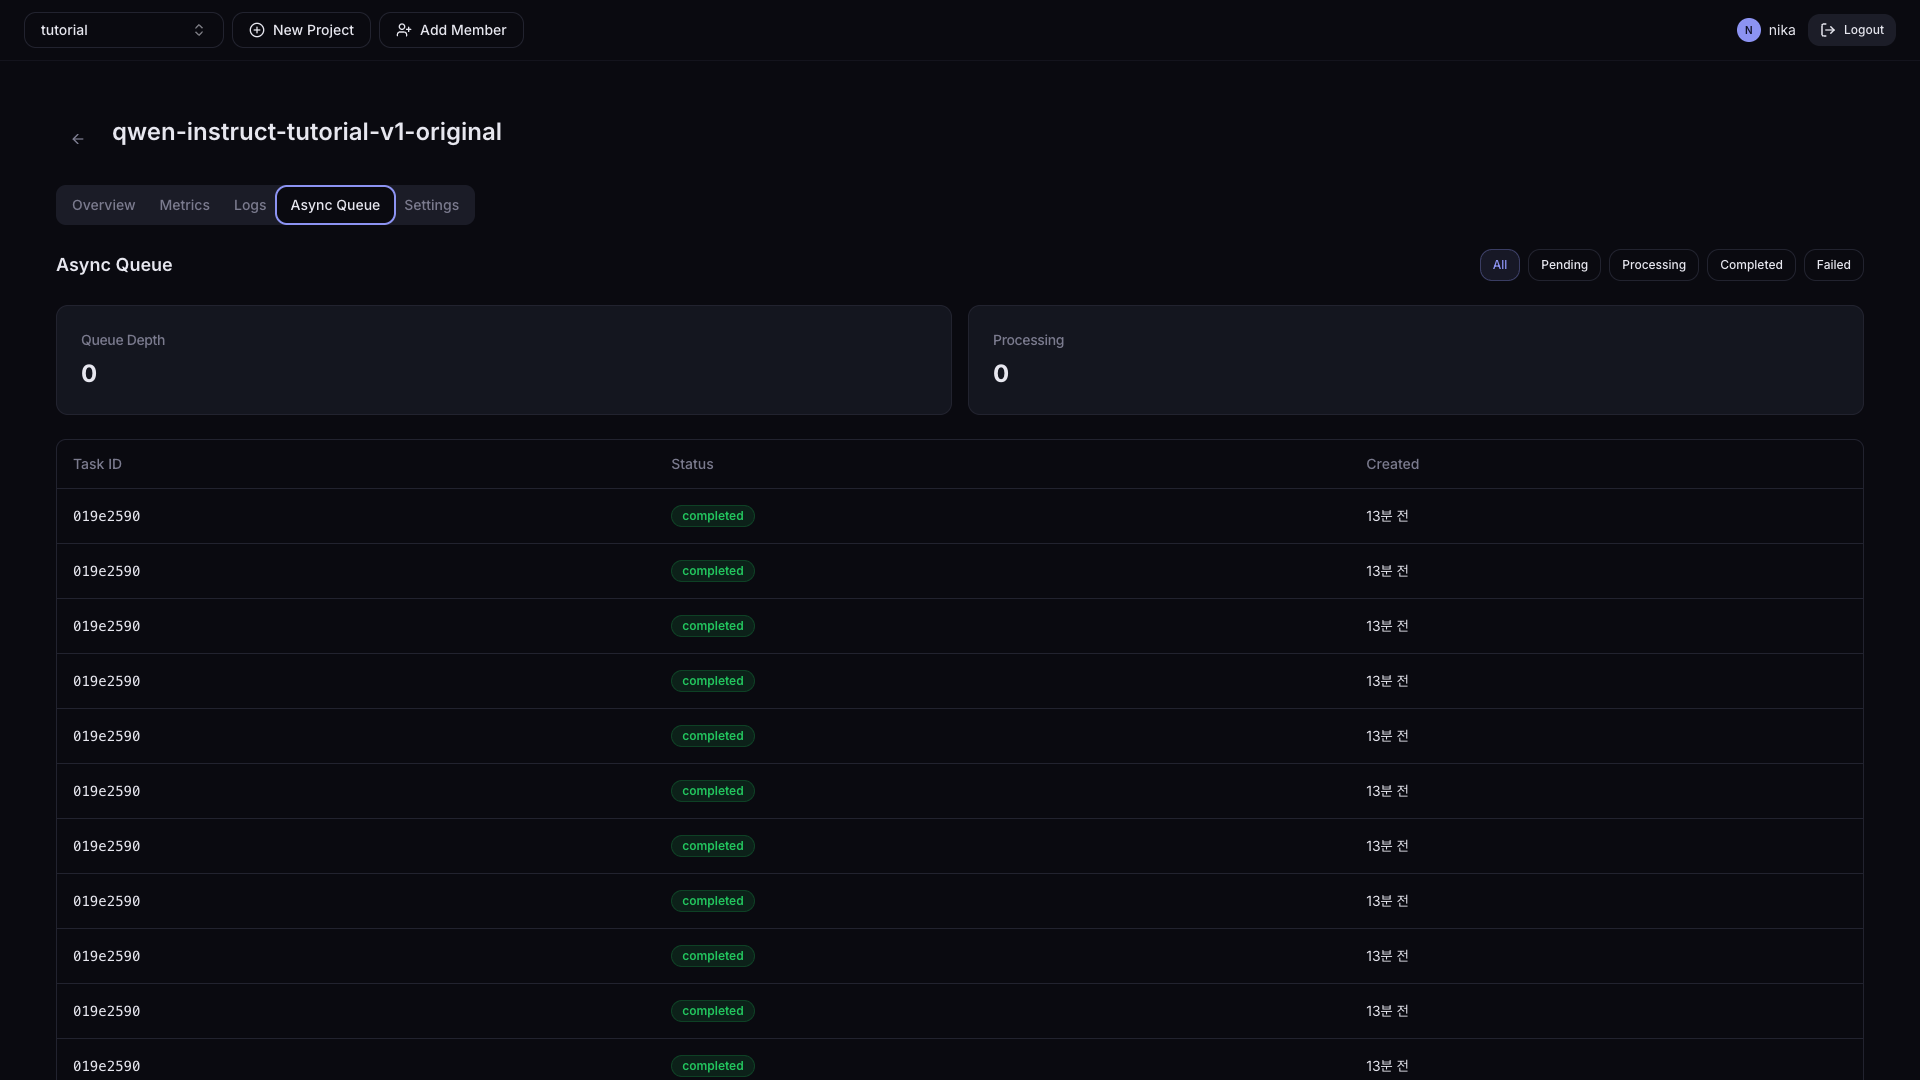
| Item | Description |
|---|---|
| Status filter | All / Pending / Processing / Completed / Failed |
| Queue Depth | Number of Tasks currently in the queue |
| Processing | Number of Tasks currently in progress |
Click a specific Task to view Request / Response details.
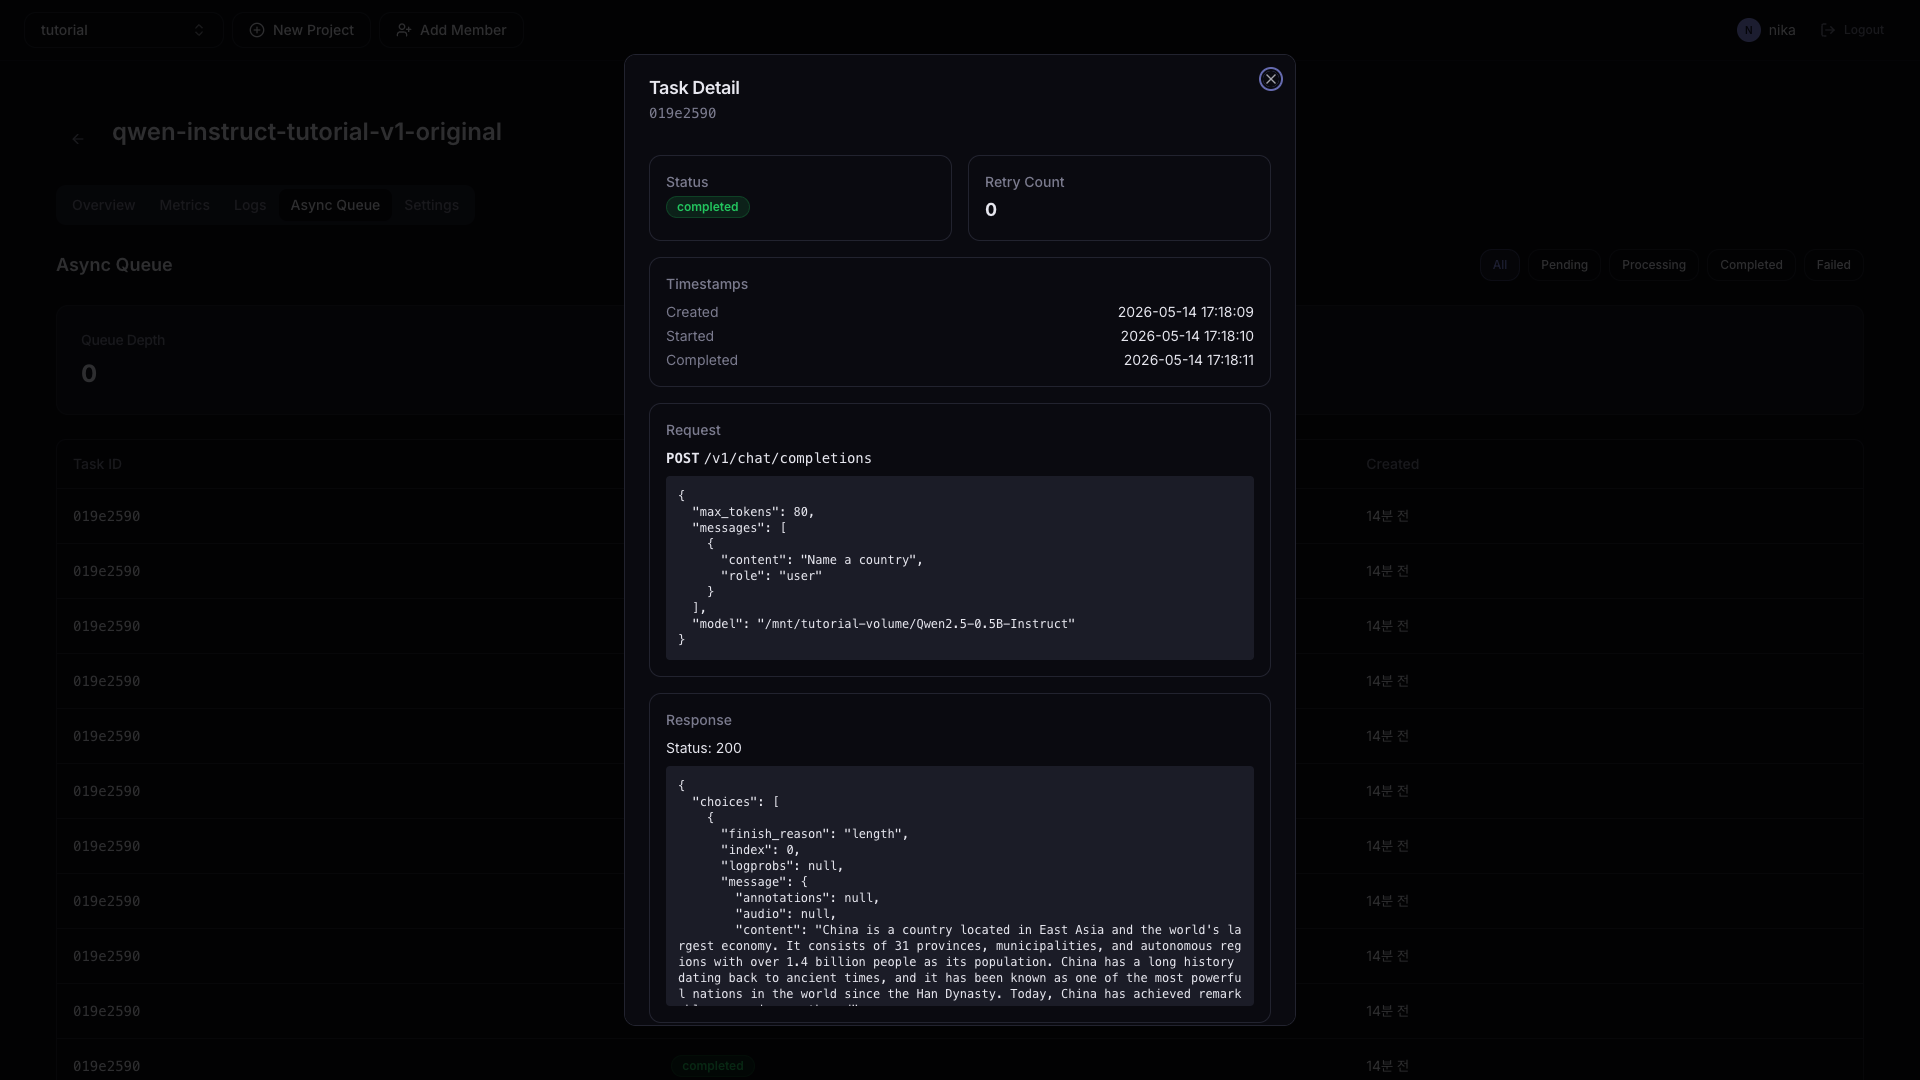
How to make an async request — Add the X-Async: true header to the HTTP request.
curl -X POST 'https://<deployment-endpoint>/v1/chat/completions' \
  -H 'Content-Type: application/json' \
  -H 'Authorization: Bearer <token>' \
  -H 'X-Async: true' \
  -d '{"model": "model-name", "messages": [{"role": "user", "content": "Hello"}]}'
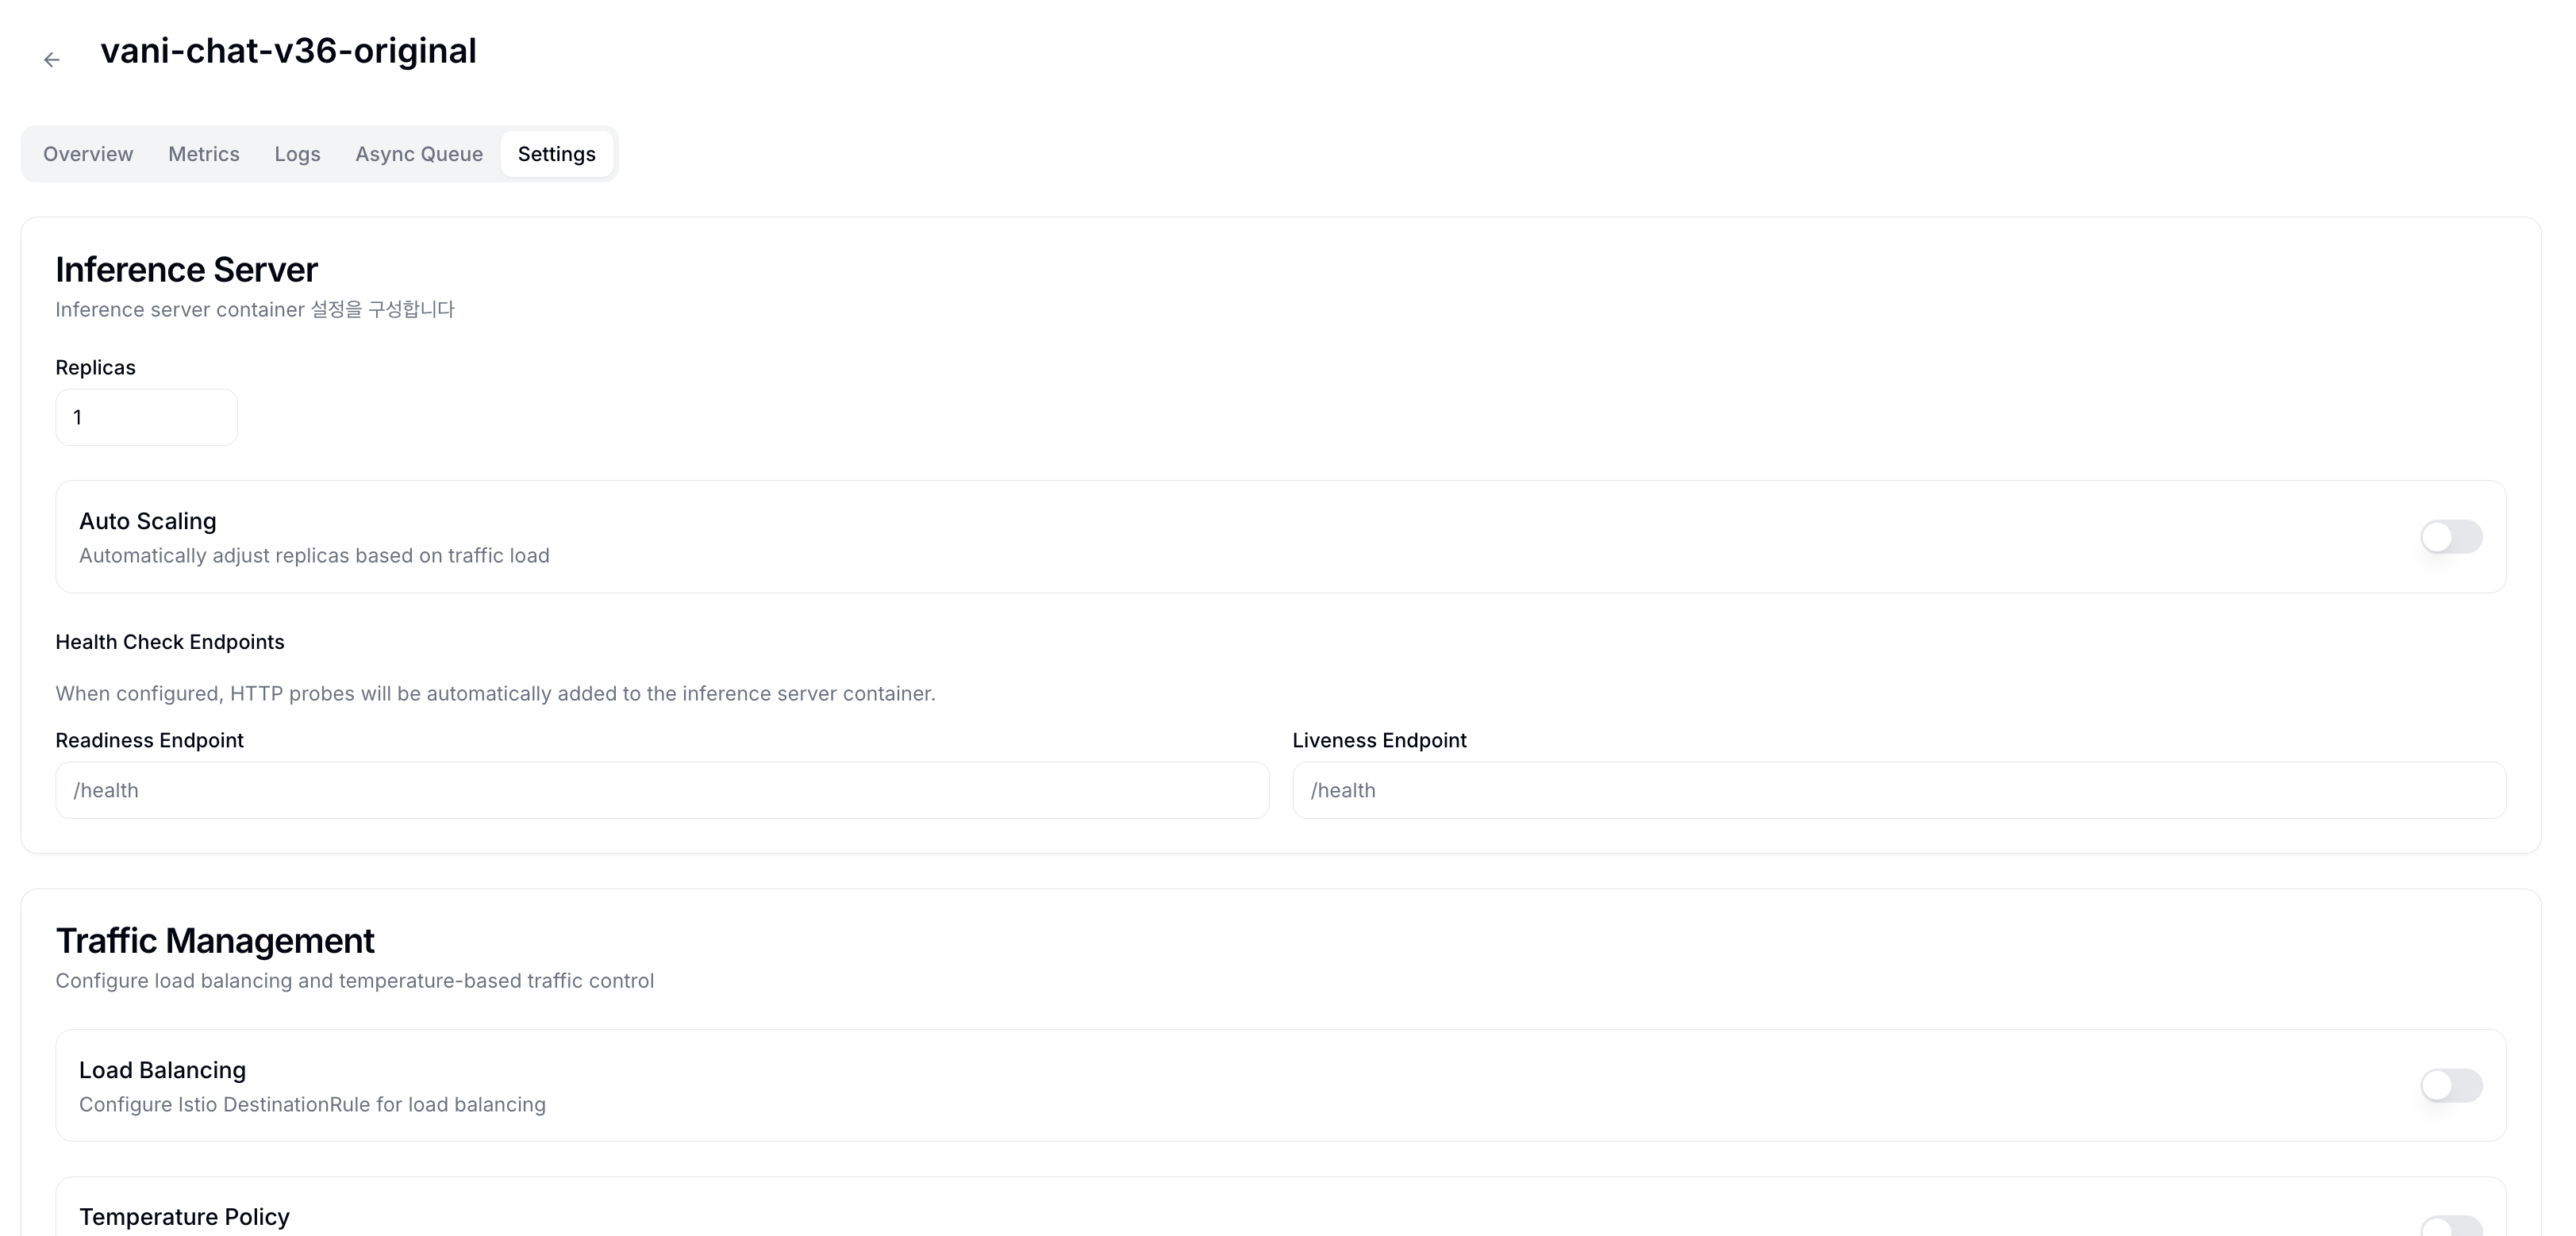
Change the settings needed to operate the Serving — inference server scaling, health checks, traffic distribution, async queue, and more. For per-item details, see Advanced Deployment Settings below.
Advanced Deployment Settings
In the Settings tab of the Serving detail page, you configure the inference server, traffic, and Transformer.
Inference Server
The Inference Server tab controls the Serving Pod count and health check endpoints.
Auto Scaling automatically increases or decreases the number of Pods based on request load. It is suitable for services with irregular or hard-to-predict traffic. To keep a fixed number of Pods running at all times, disable it and adjust Replicas only.
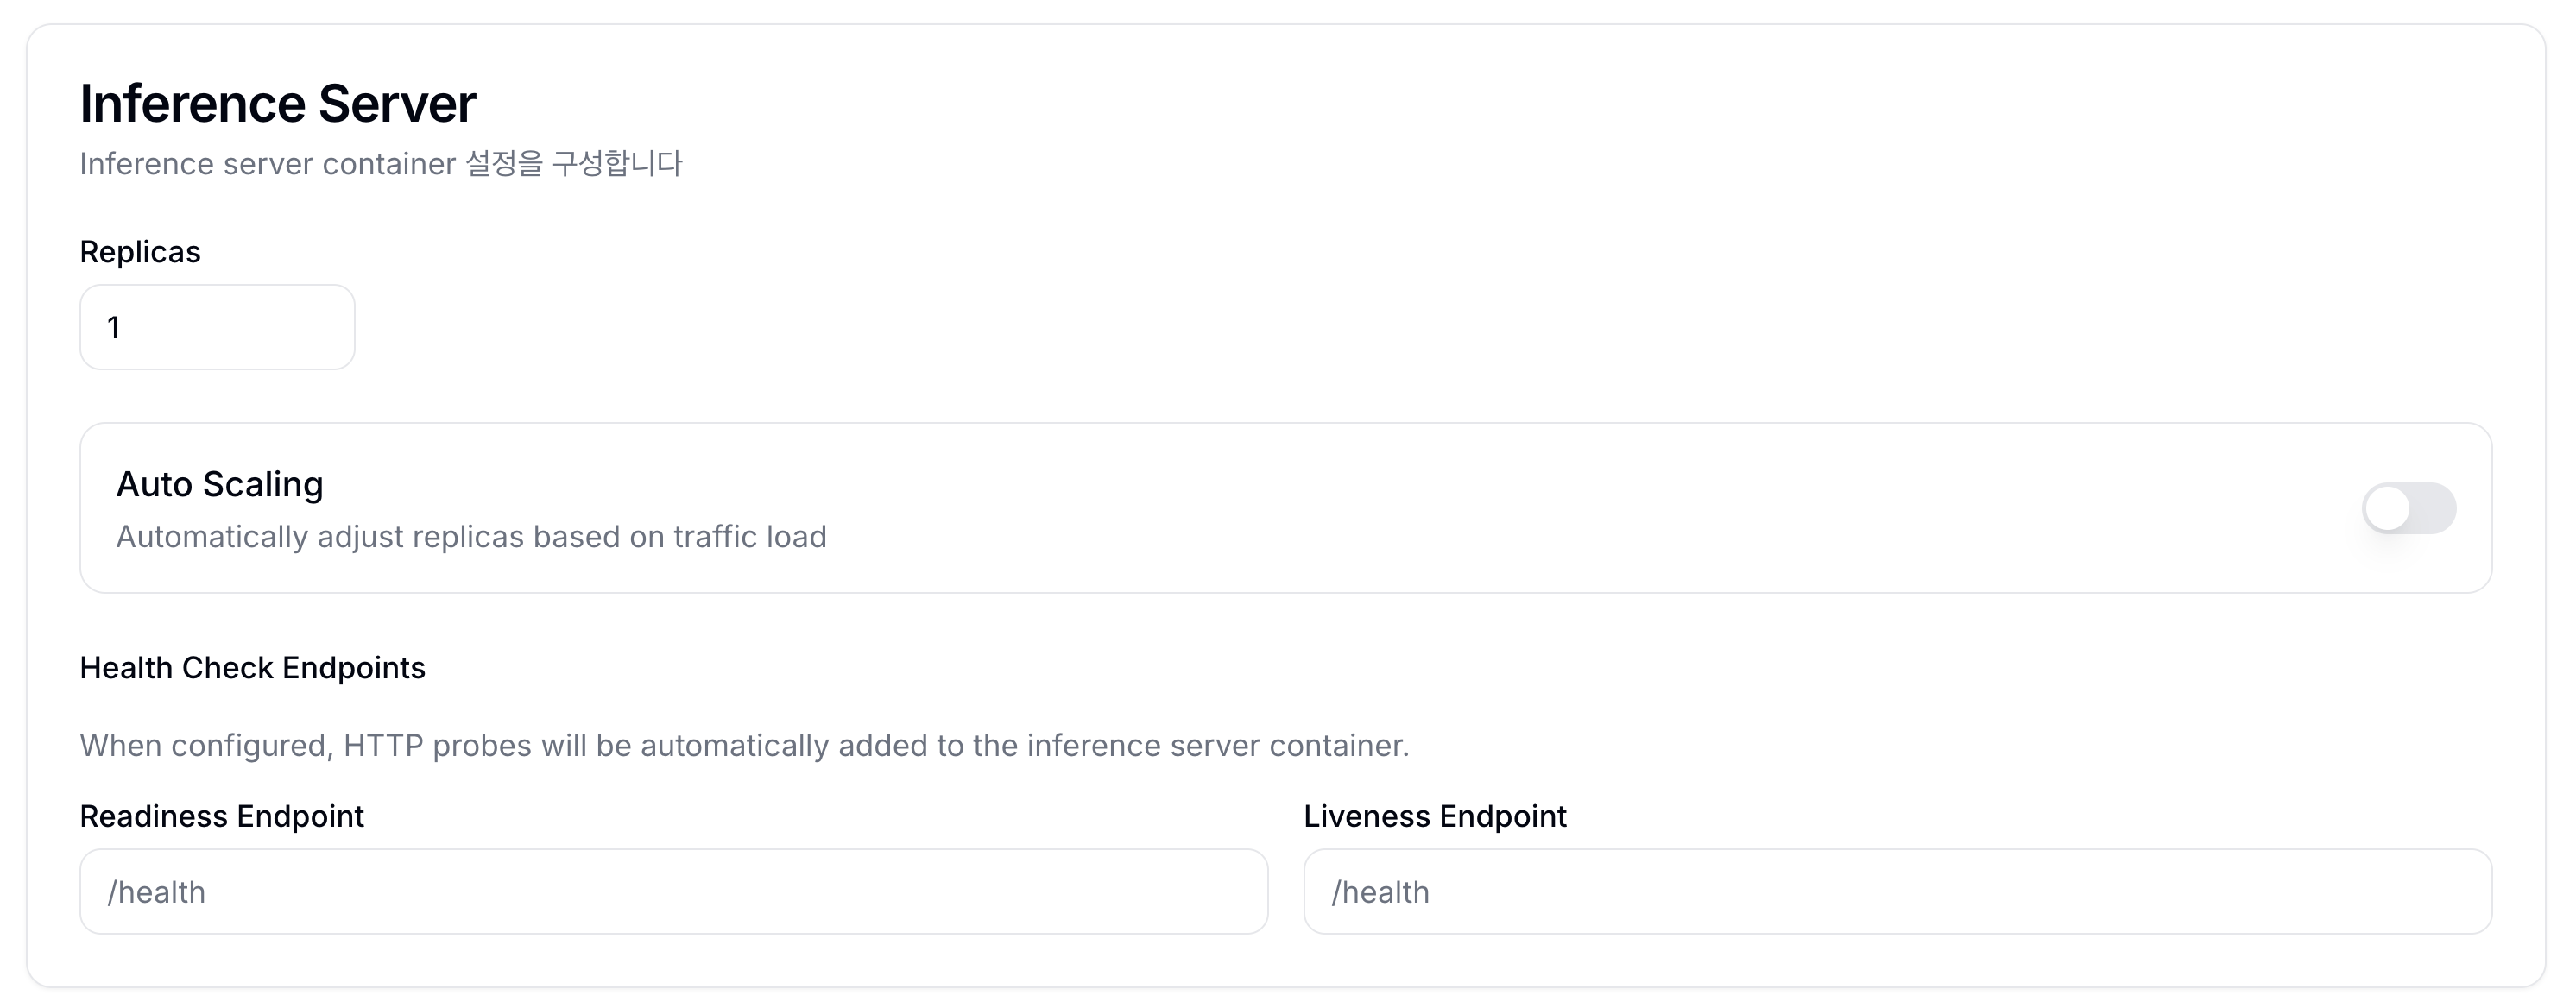
| Setting | Description | Default |
|---|---|---|
| Replicas | Adjust the number of replicas | 1 |
| Auto Scaling | Automatically adjust the Pod count based on traffic load | Off |
| Readiness Endpoint | Endpoint to check whether a Pod is ready to receive traffic (e.g., /health, /v1/models) | - |
| Liveness Endpoint | Endpoint to check whether a Pod is operating normally. Repeated failures trigger automatic restart (e.g., /health, /healthz) | - |
Additional settings when Auto Scaling is enabled:
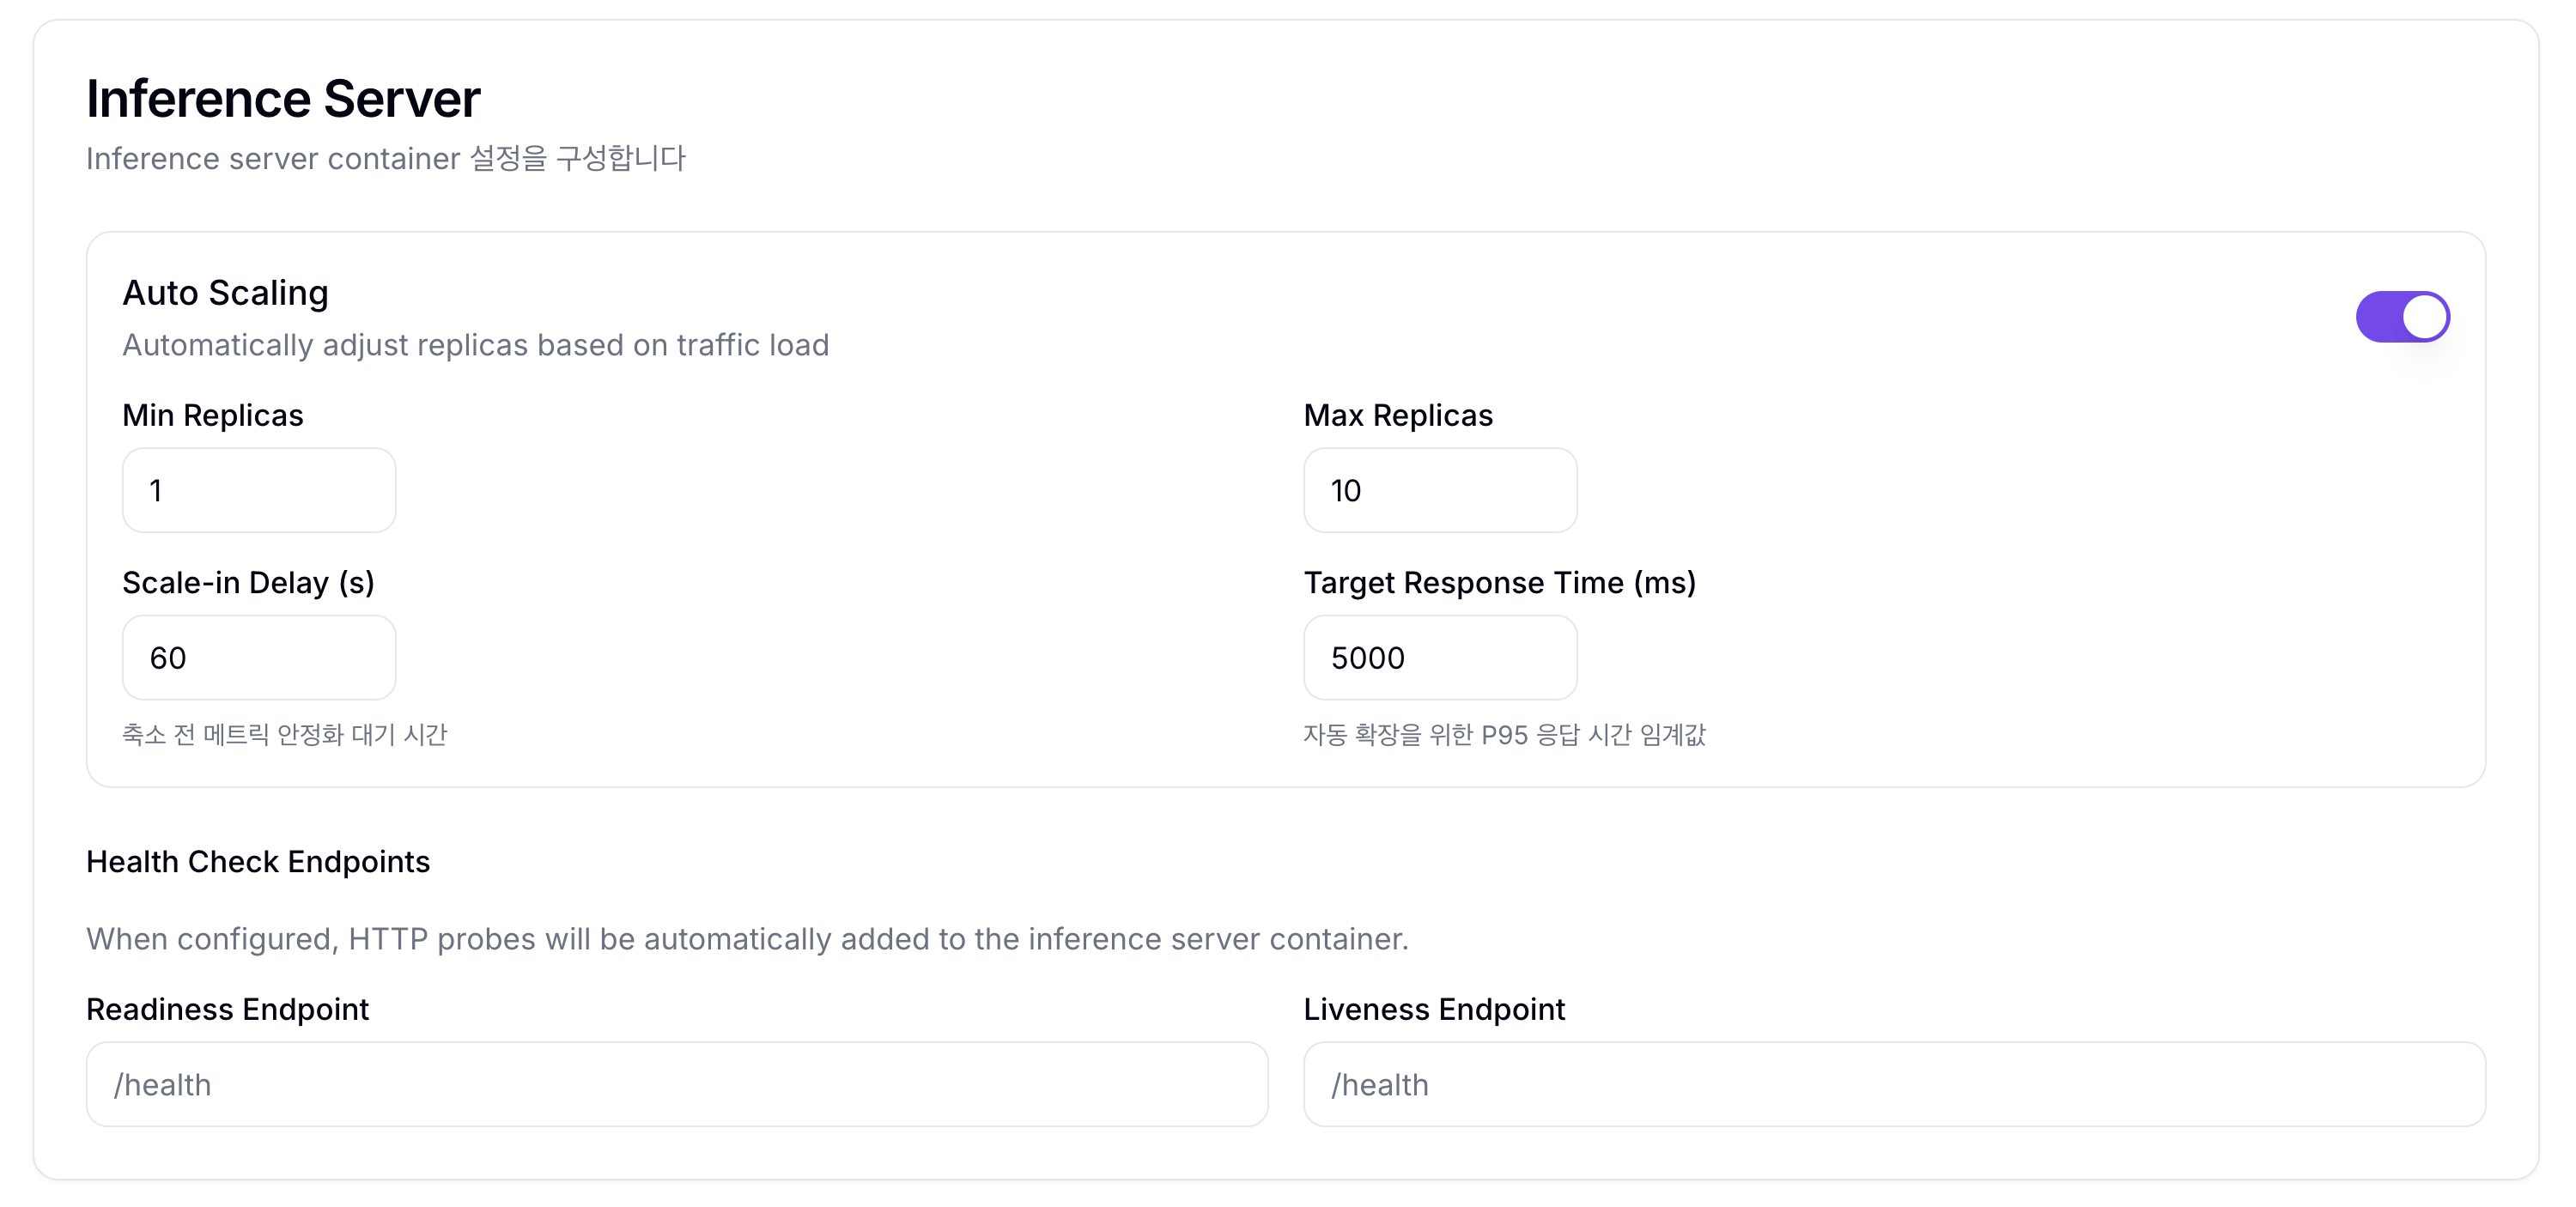
| Setting | Description | Default |
|---|---|---|
| Min Replicas | Minimum number of Pods to keep running at all times. The minimum value is 1; 0 (scale-to-zero) is not supported. | 1 |
| Scale-in Delay (s) | Wait time after traffic decrease before scaling Pods down (prevents flapping) | 60 |
| Max Replicas | Maximum number of Pods (consider cluster accelerator headroom) | 10 |
| Target Response Time (ms) | Target P95 response time used as the auto-scale trigger. Pods are added when exceeded. | 5000 |
Traffic Management
Traffic Management is a group of features that control how requests are distributed across multiple Pods, temperature-based traffic protection, and async processing. If you are running with a single Pod, you can leave Load Balancing and Temperature Policy disabled. Async Queue is used for async workflows where the client submits a request without waiting for an immediate response and retrieves the result later.
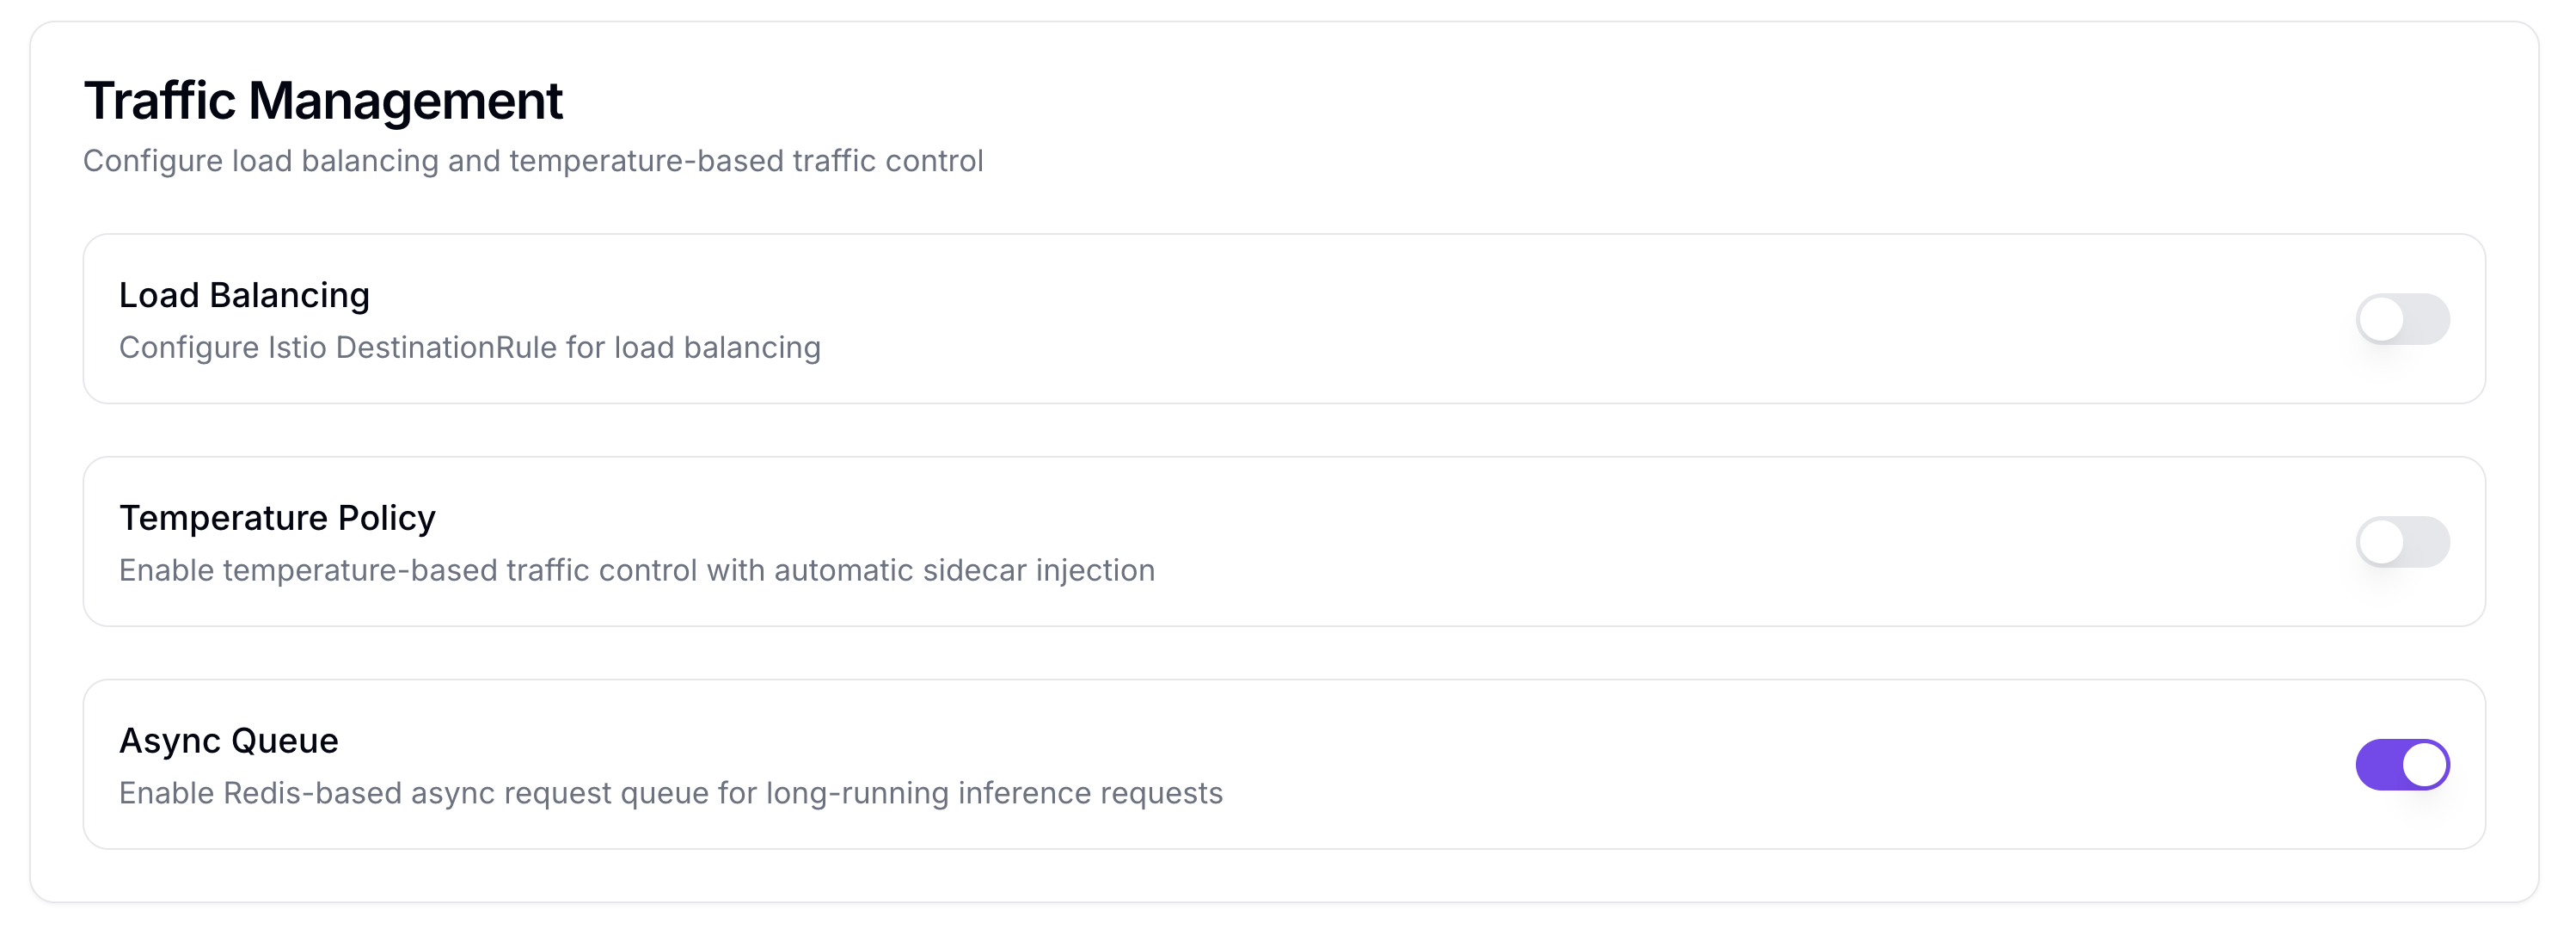
| Feature | Description | Default |
|---|---|---|
| Load Balancing | Distribute requests across multiple Pods. Recommended when Replicas is 2 or more. | Off |
| Temperature Policy | Automatically block traffic to a Pod when GPU/NPU temperature exceeds a threshold, and resume when it recovers. Recommended for hardware protection during long, high-load inference. | Off |
| Async Queue | Enable a Redis-based async request queue. Suitable for batch inference or long-running tasks where the client does not need to wait for an immediate response after submission. | Off |
When Load Balancing is enabled, a Policy dropdown appears:
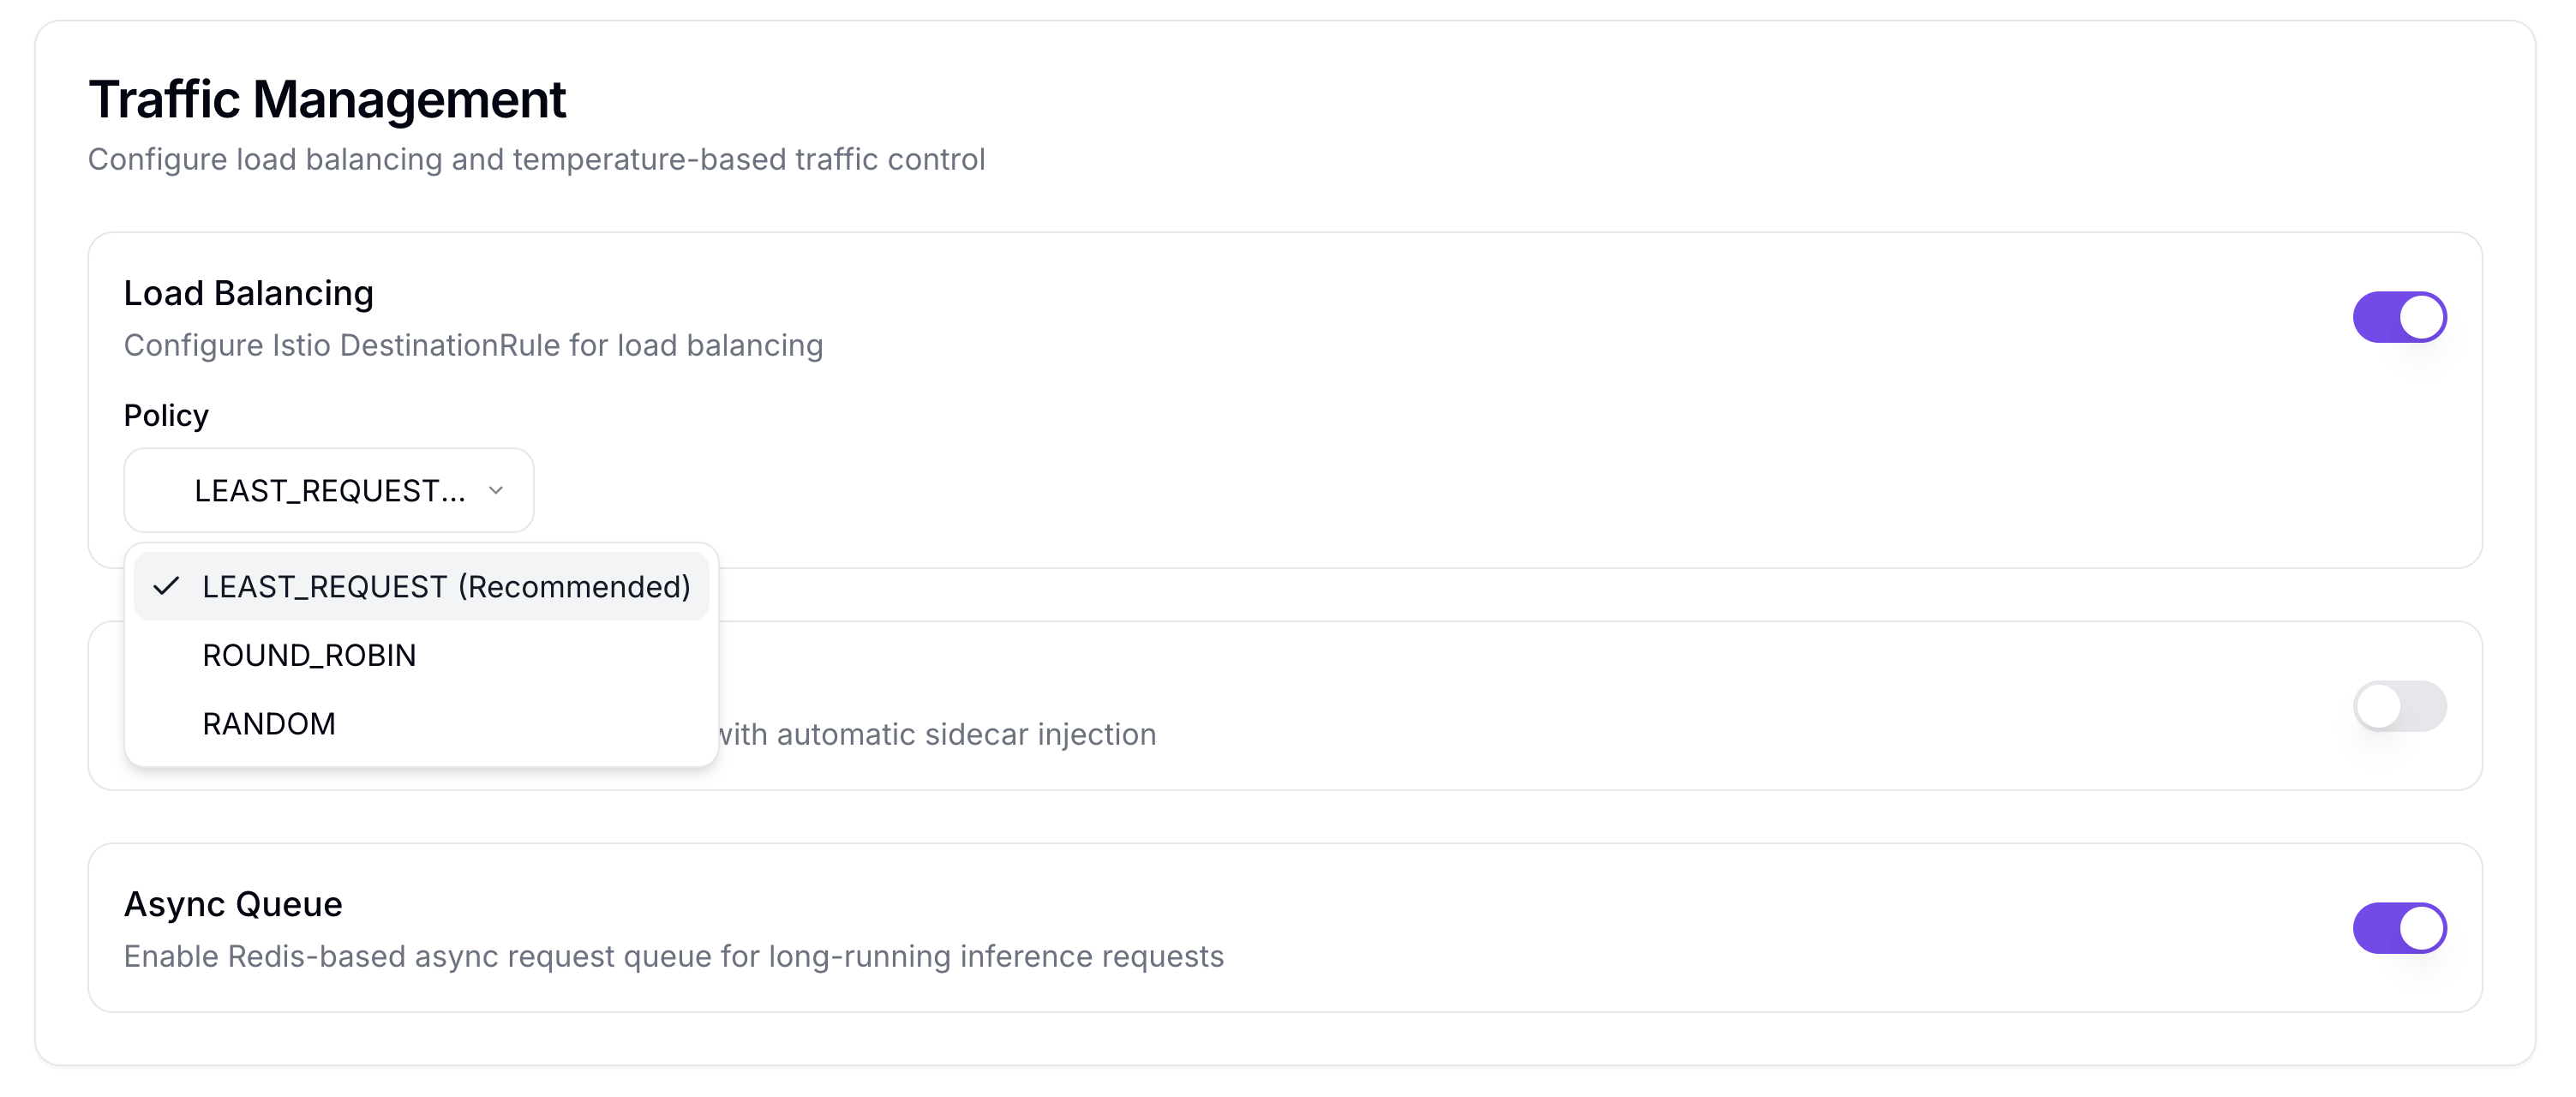
| Option | Description |
|---|---|
| LEAST_REQUEST (Recommended) | Route to the Pod with the fewest active requests (default) |
| ROUND_ROBIN | Route to Pods in rotation |
| RANDOM | Route to a randomly selected Pod |
When Temperature Policy is enabled, threshold settings appear:
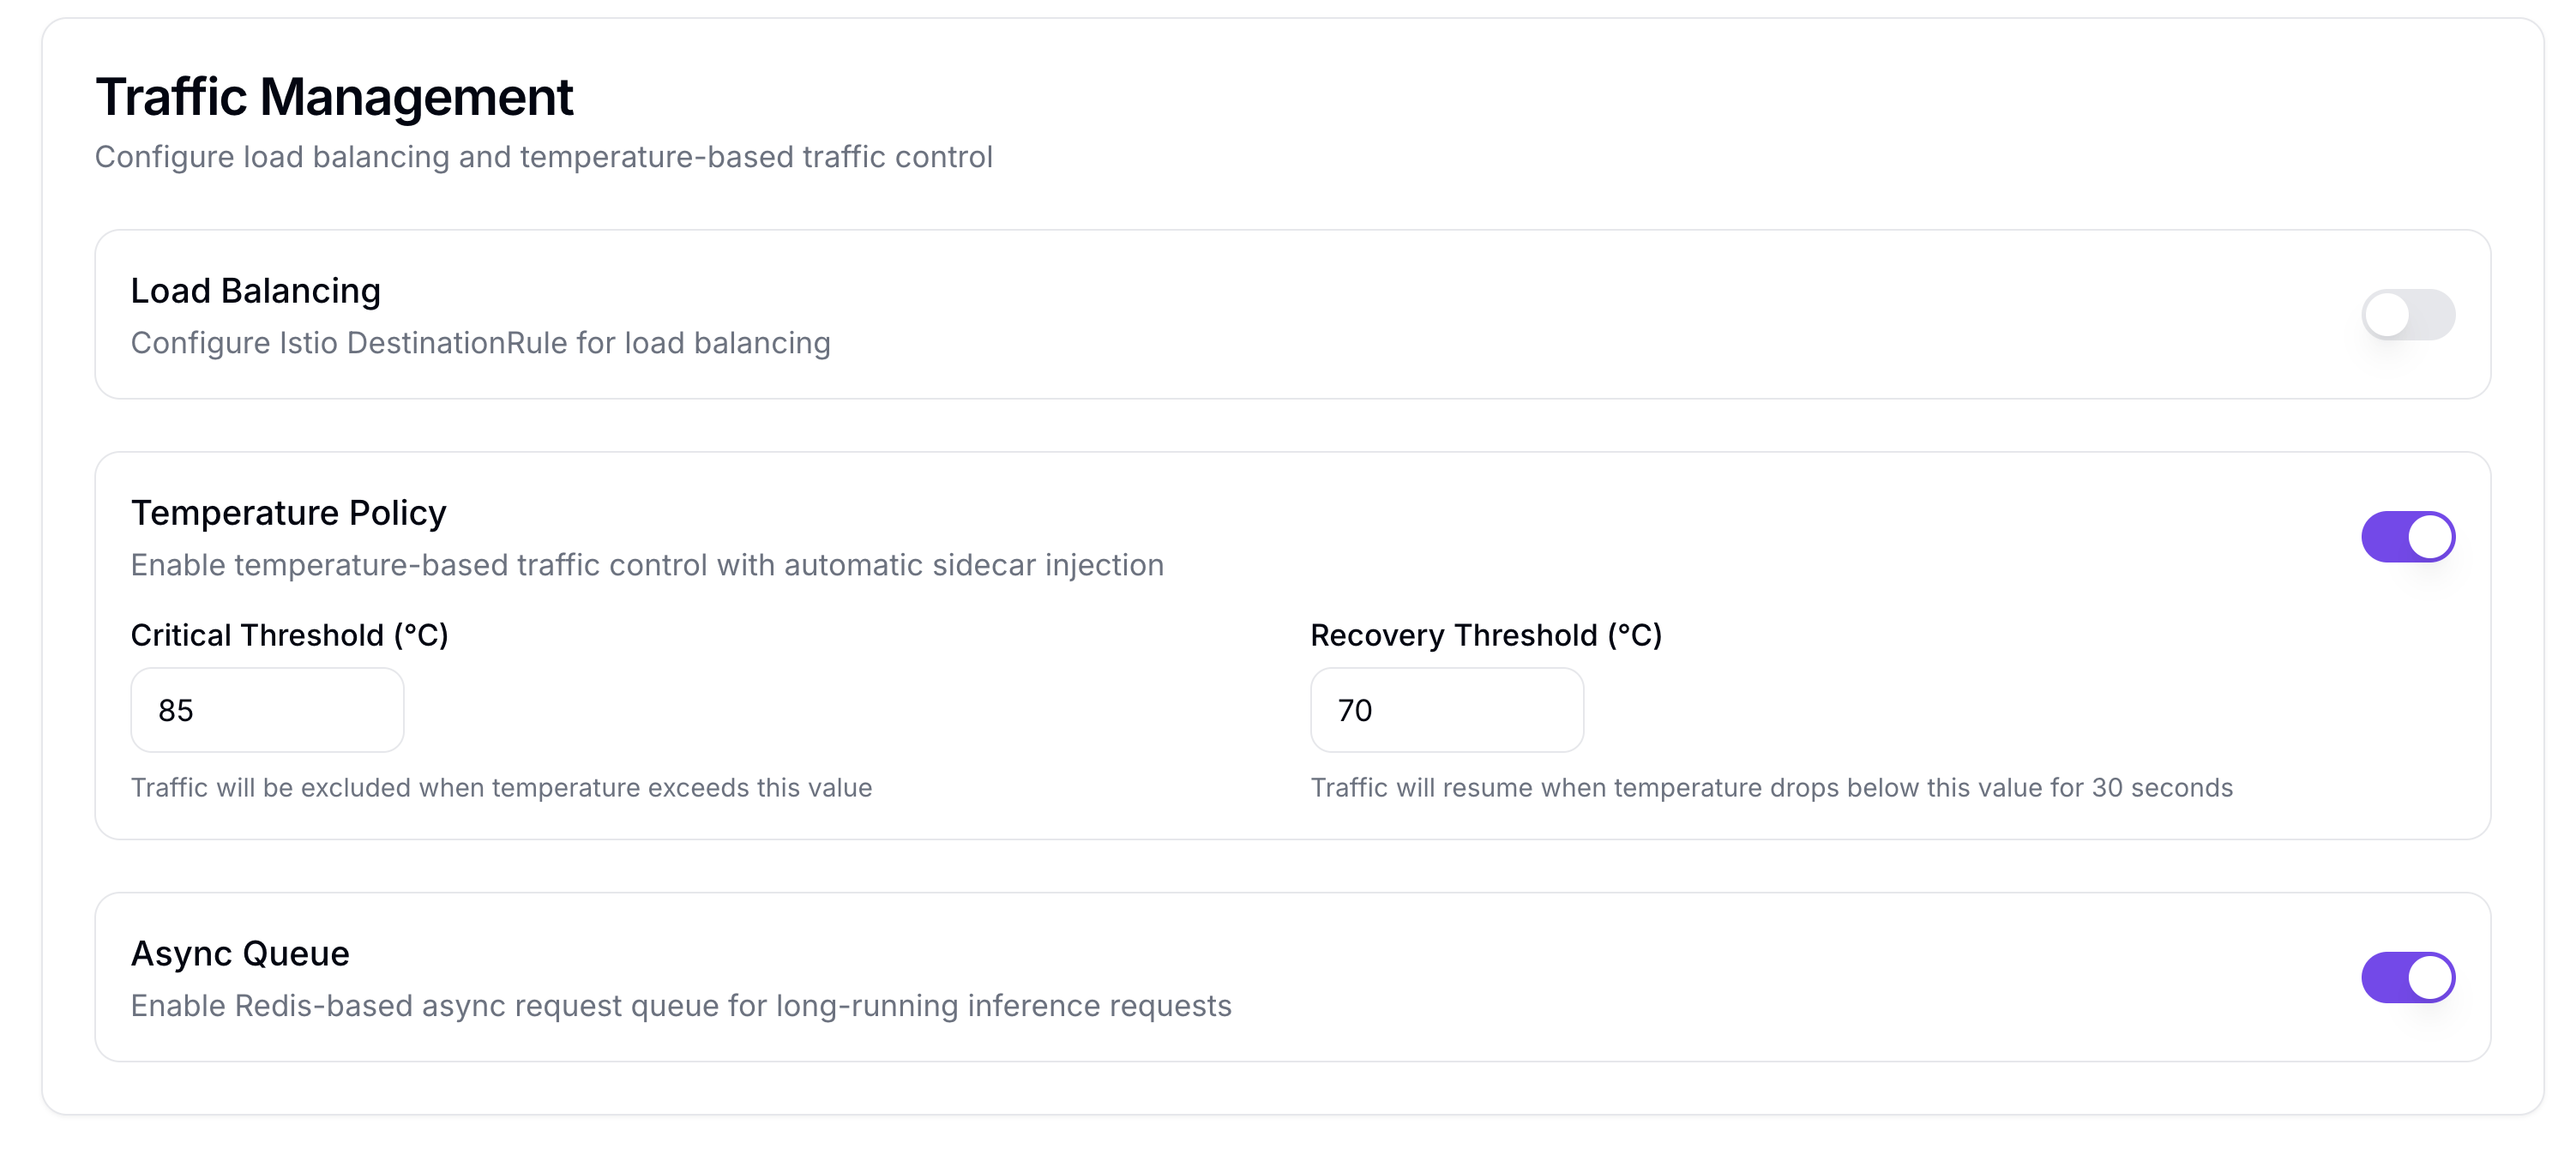
| Setting | Description | Default |
|---|---|---|
| Critical Threshold (°C) | Temperature at which traffic is blocked | 85 |
| Recovery Threshold (°C) | Temperature at which traffic resumes | 70 |