Check Metrics in Monitoring
Use NuFi's Monitoring menu to view real-time performance metrics of serving models.
Access the Monitoring Dashboard
In the left sidebar, click Monitoring. In the Device Overview tab, select a GPU or RNGD node to view its resource usage.
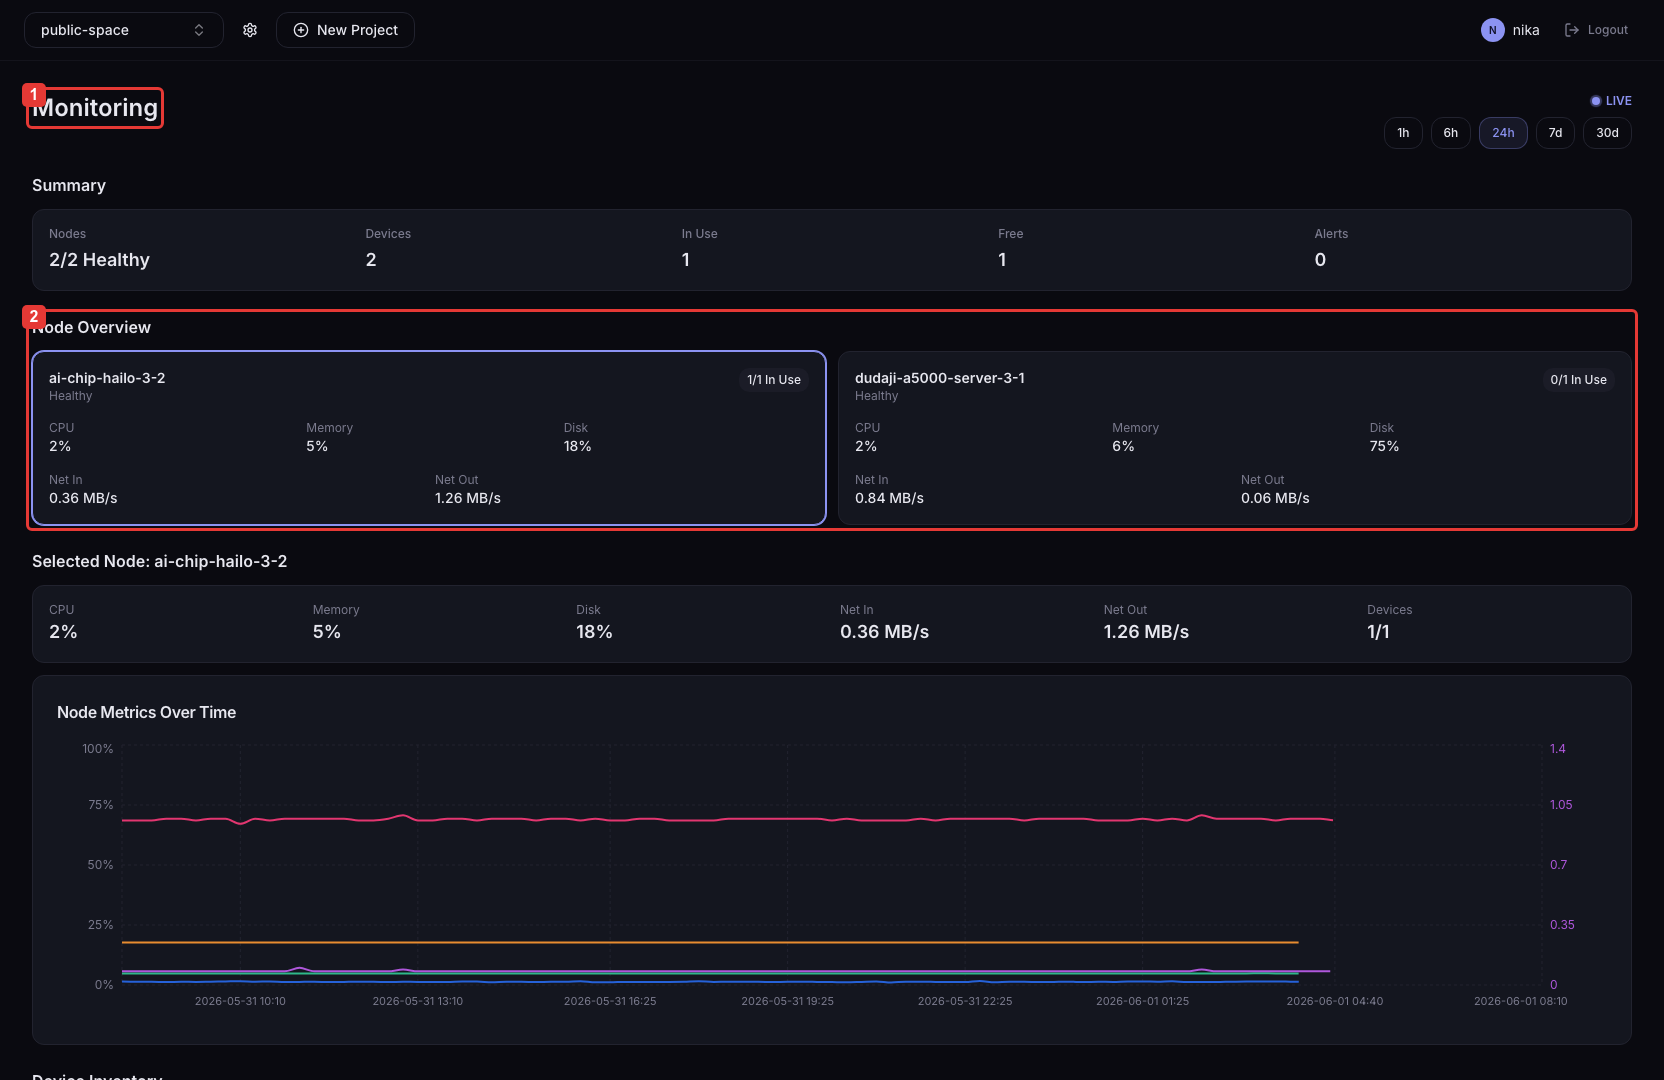
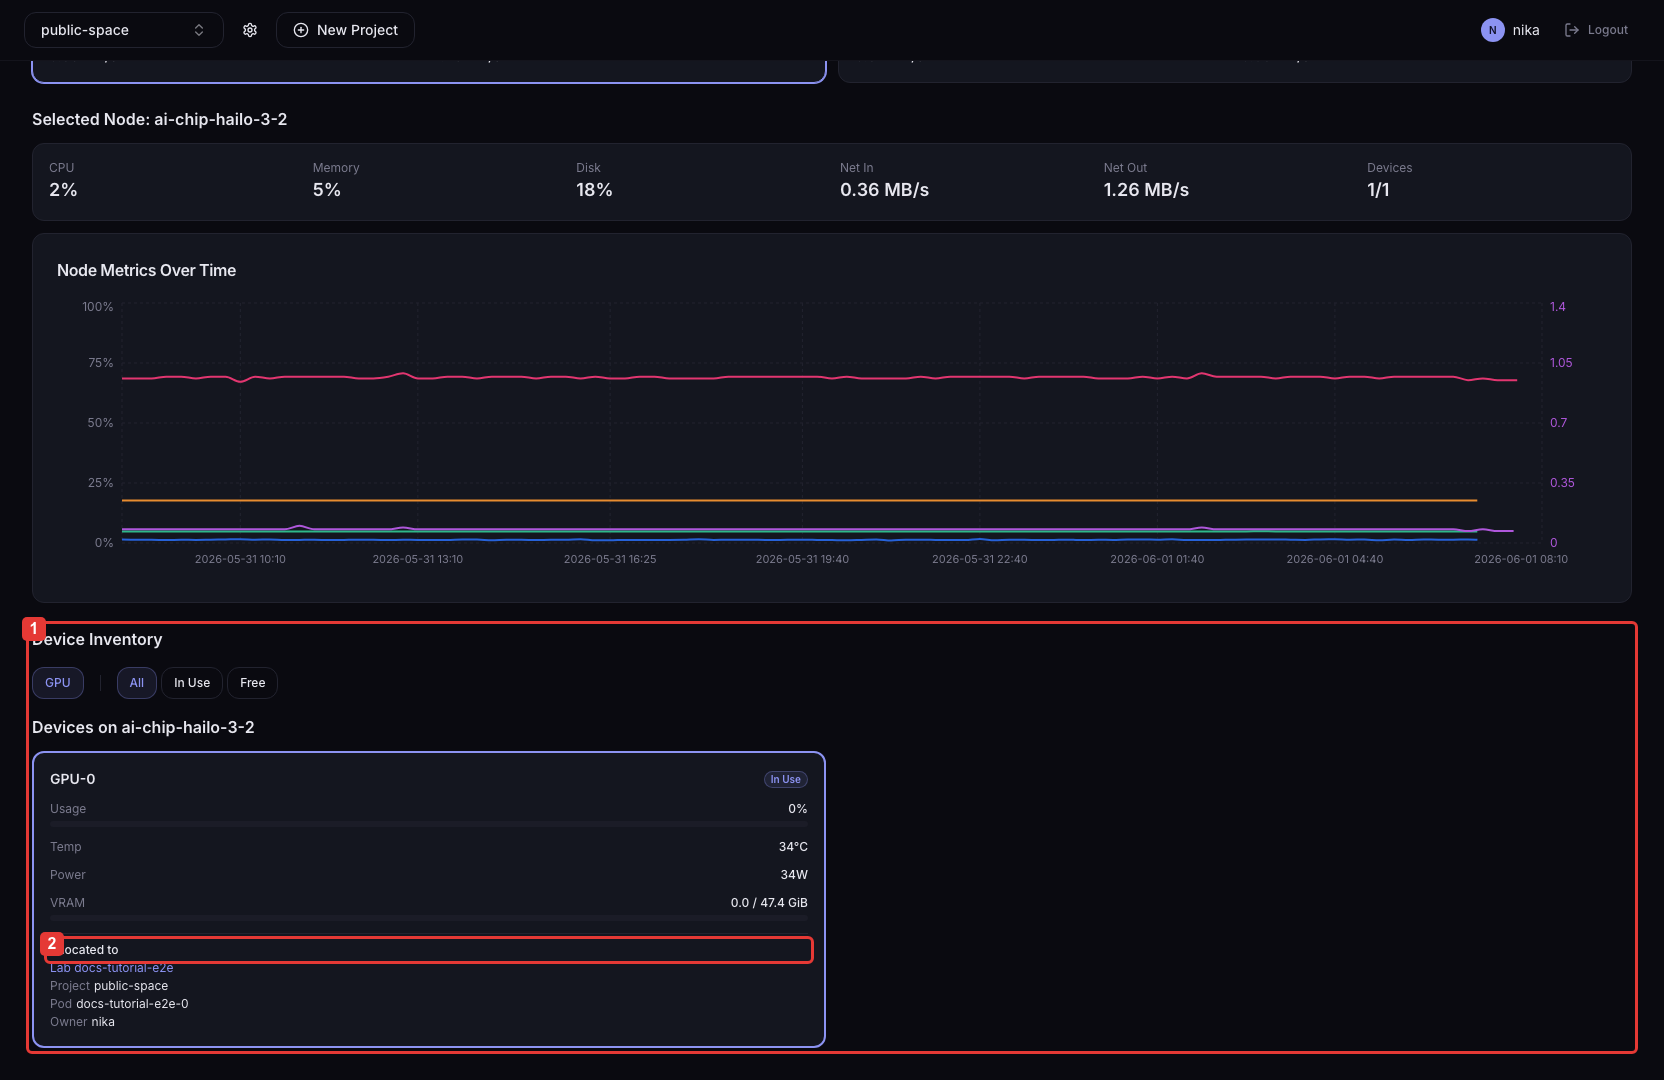
Available Metrics
The Monitoring dashboard provides the following metrics:
- Request Count: number of requests
- Error Rate: error rate
- Latency / TTFT: response latency and time to first token
- TPS (tokens/sec): token throughput per second
- Accelerator Utilization: GPU/NPU utilization
- Power (W): power consumption
- Performance/Watt (TPS/W): throughput per watt
Tutorial Complete
You have checked the serving response and cluster resource metrics.