Monitoring
This page walks you through checking the resource status of the entire cluster and the state of GPU/NPU devices.
Click the Monitoring menu in the left sidebar to see system monitoring information.
Cluster Overview
Shows the cluster-wide average resource usage as cards and time-series graphs.
Use the time buttons (1h / 6h / 24h / 7d) in the upper right to adjust the time-series graph range.
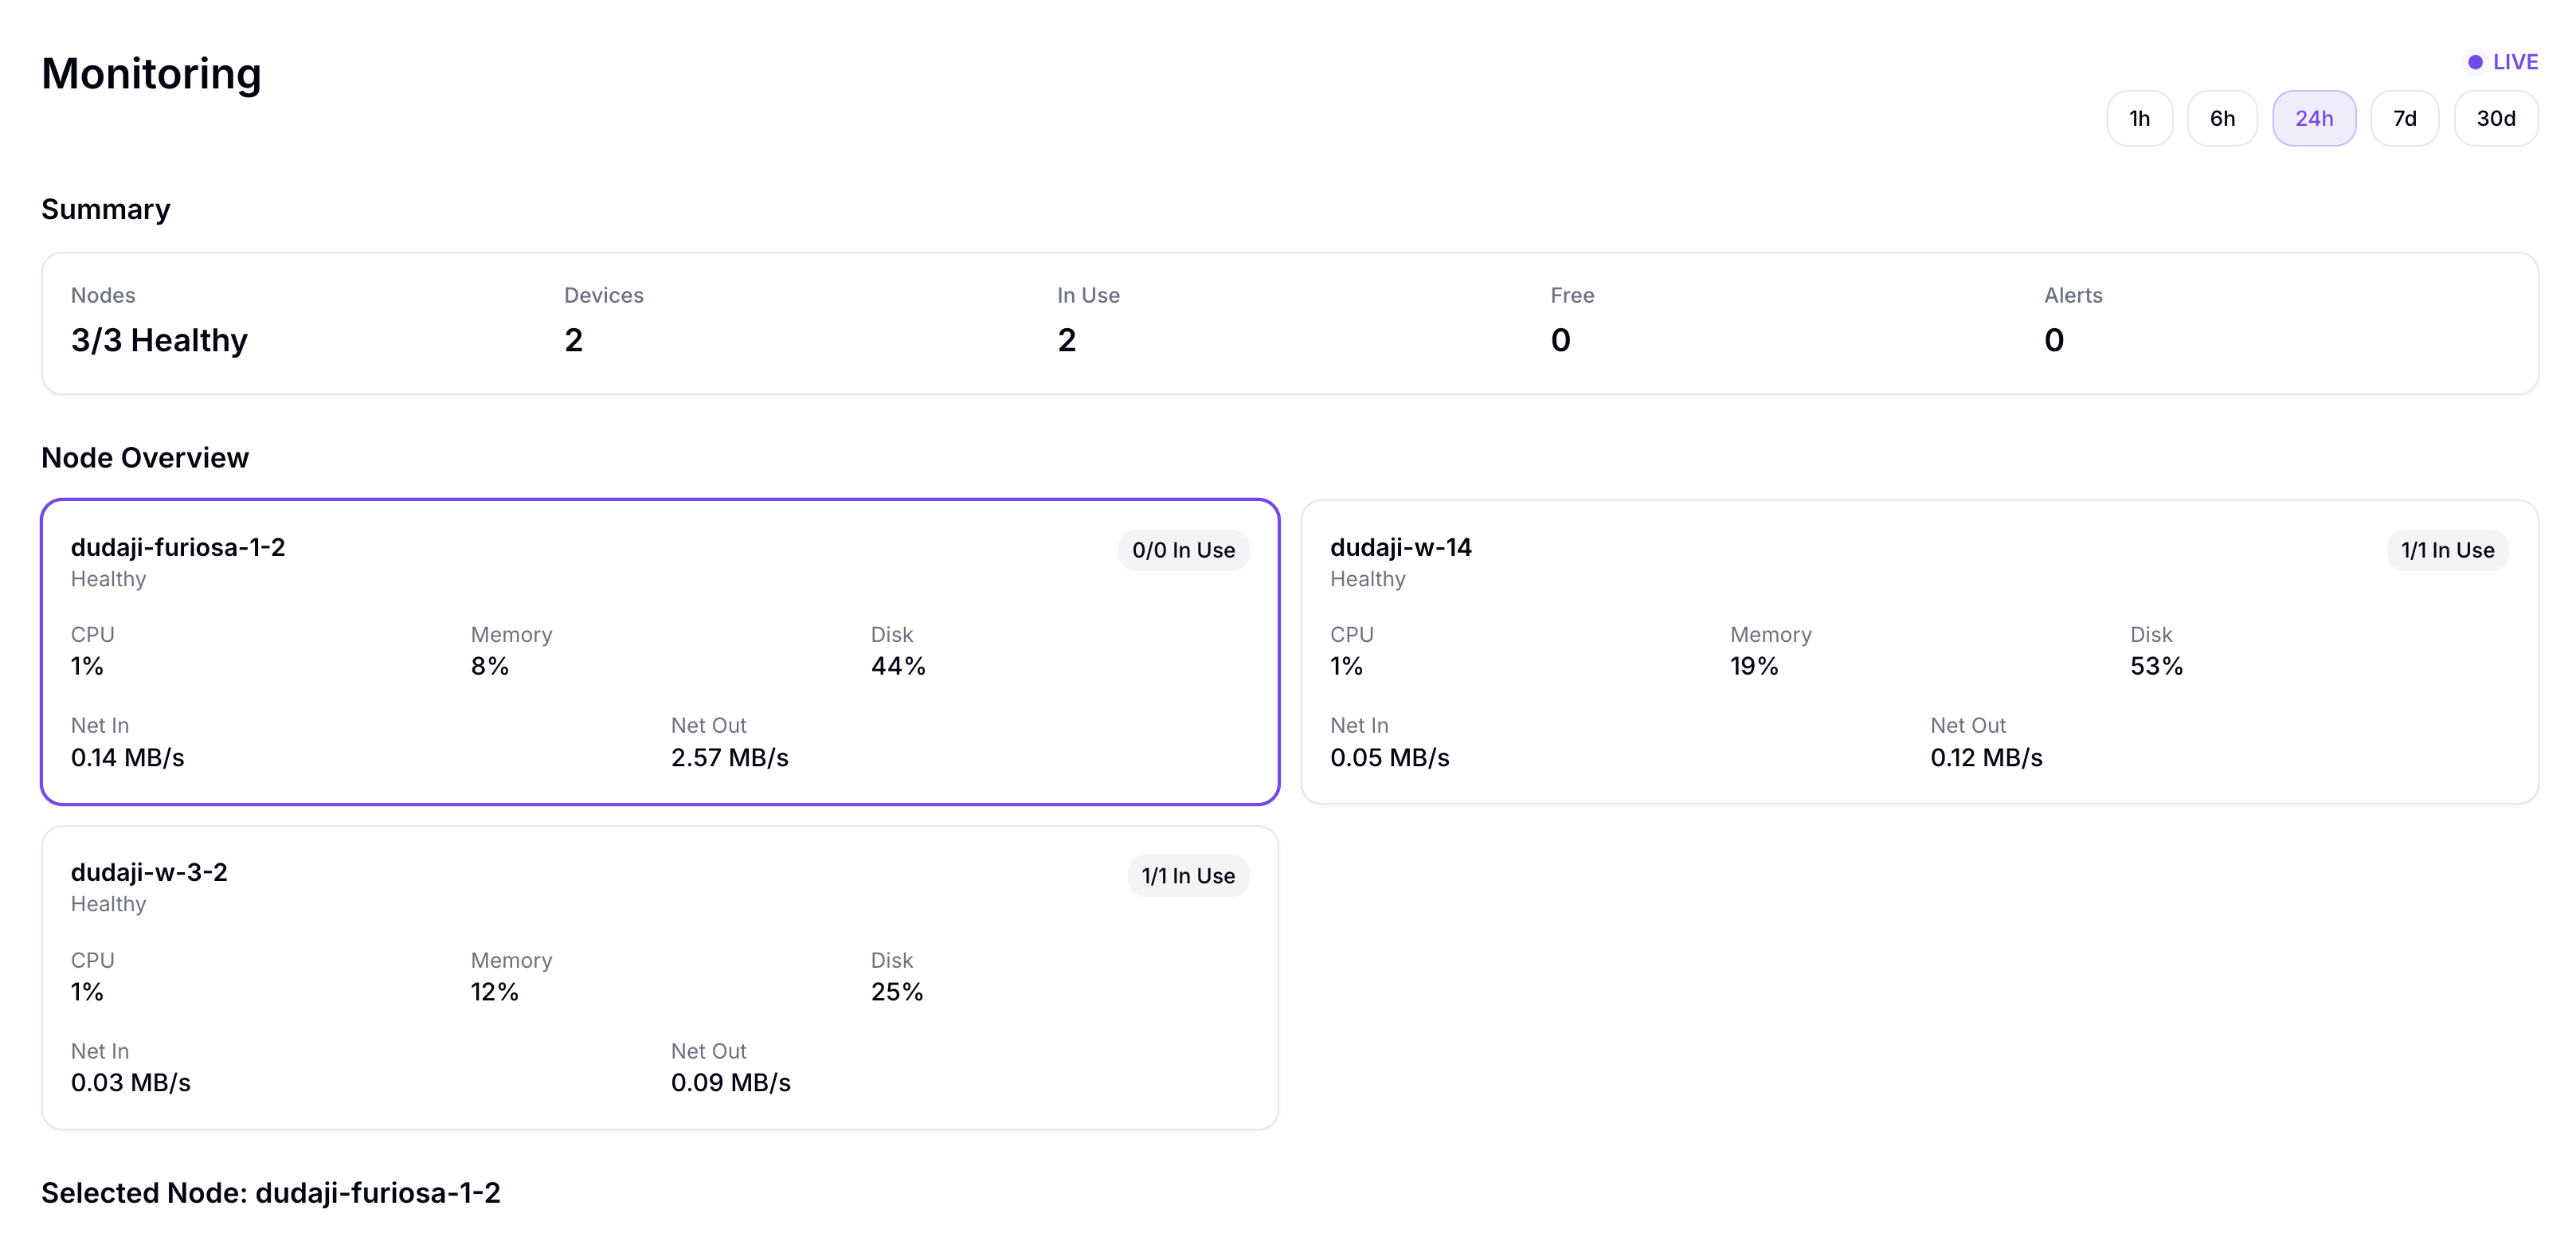
| Card | Description |
|---|---|
| CPU | Average CPU usage across cluster nodes |
| Memory | Average memory usage across cluster nodes |
| Disk | Disk usage across cluster nodes |
| Time-series graphs | Time series for the items above |
Device Overview
Shows the status of GPU/NPU accelerators.
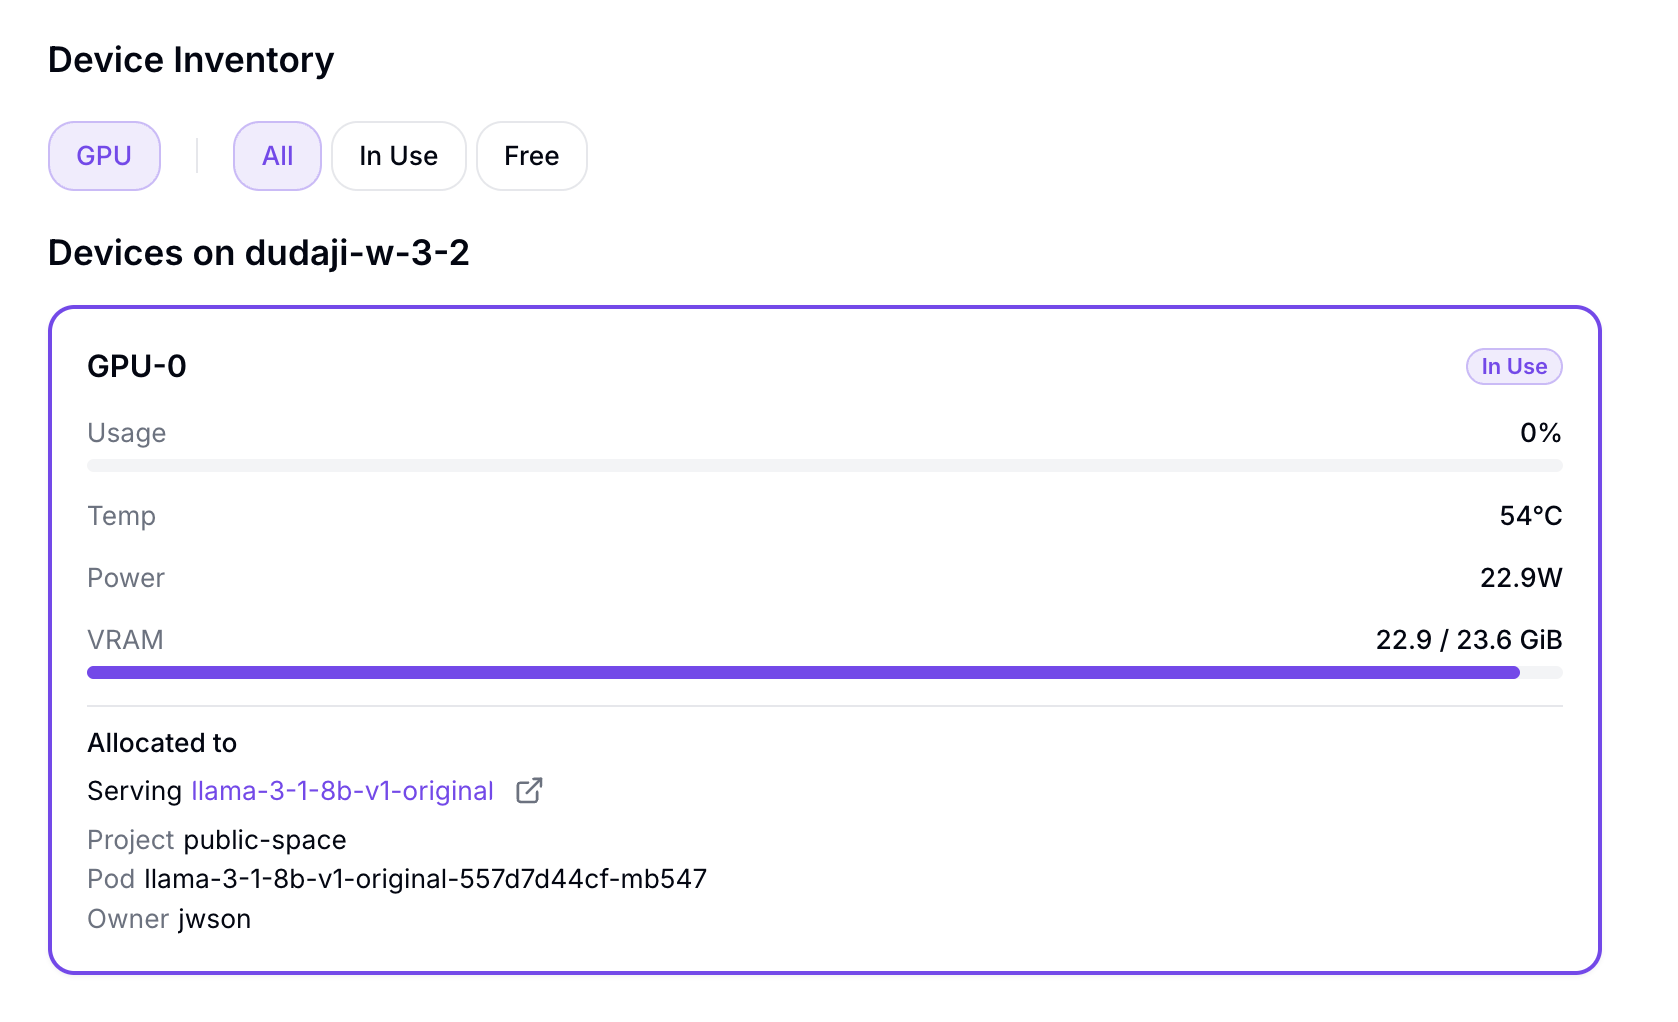
| Item | Description |
|---|---|
| Per-accelerator-type overview | Total / Allocated / Unallocated counts and average utilization |
| Accelerator type filter | Filter by accelerator type |
| Accelerator allocation status filter | Filter by accelerator allocation status |
| Node card | Per-node CPU / Memory / Disk usage and information on installed accelerators |
| Device card | Per-device Usage / Temp / Power / VRAM usage, plus assigned Pod information |
tip
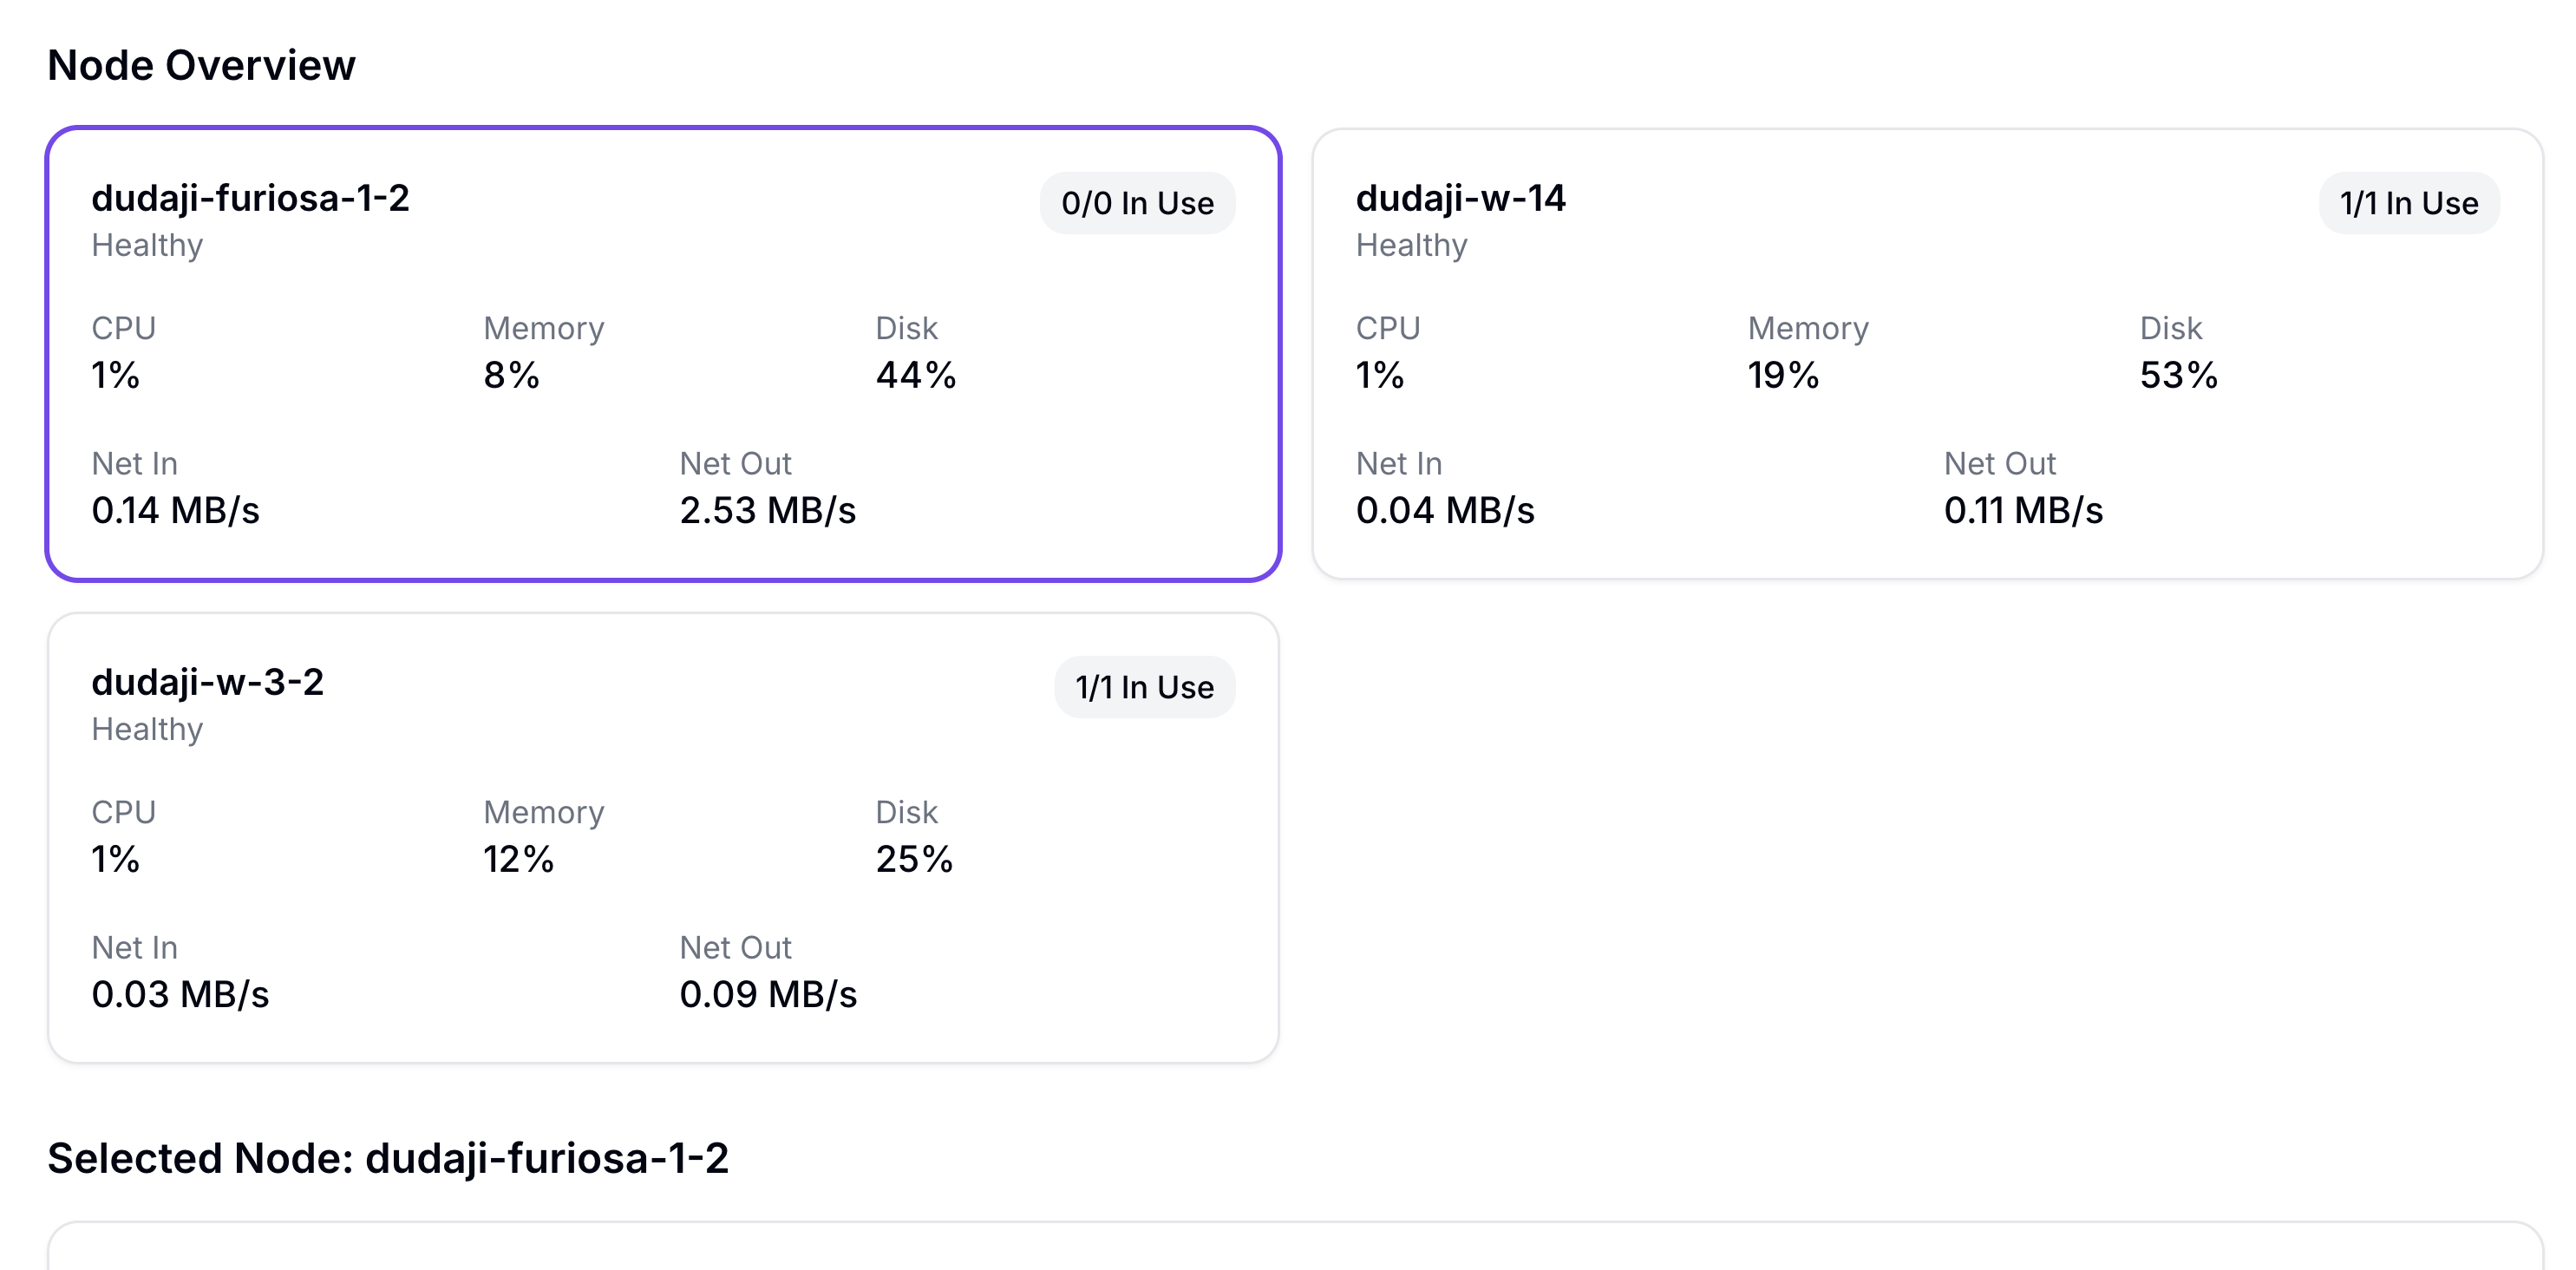
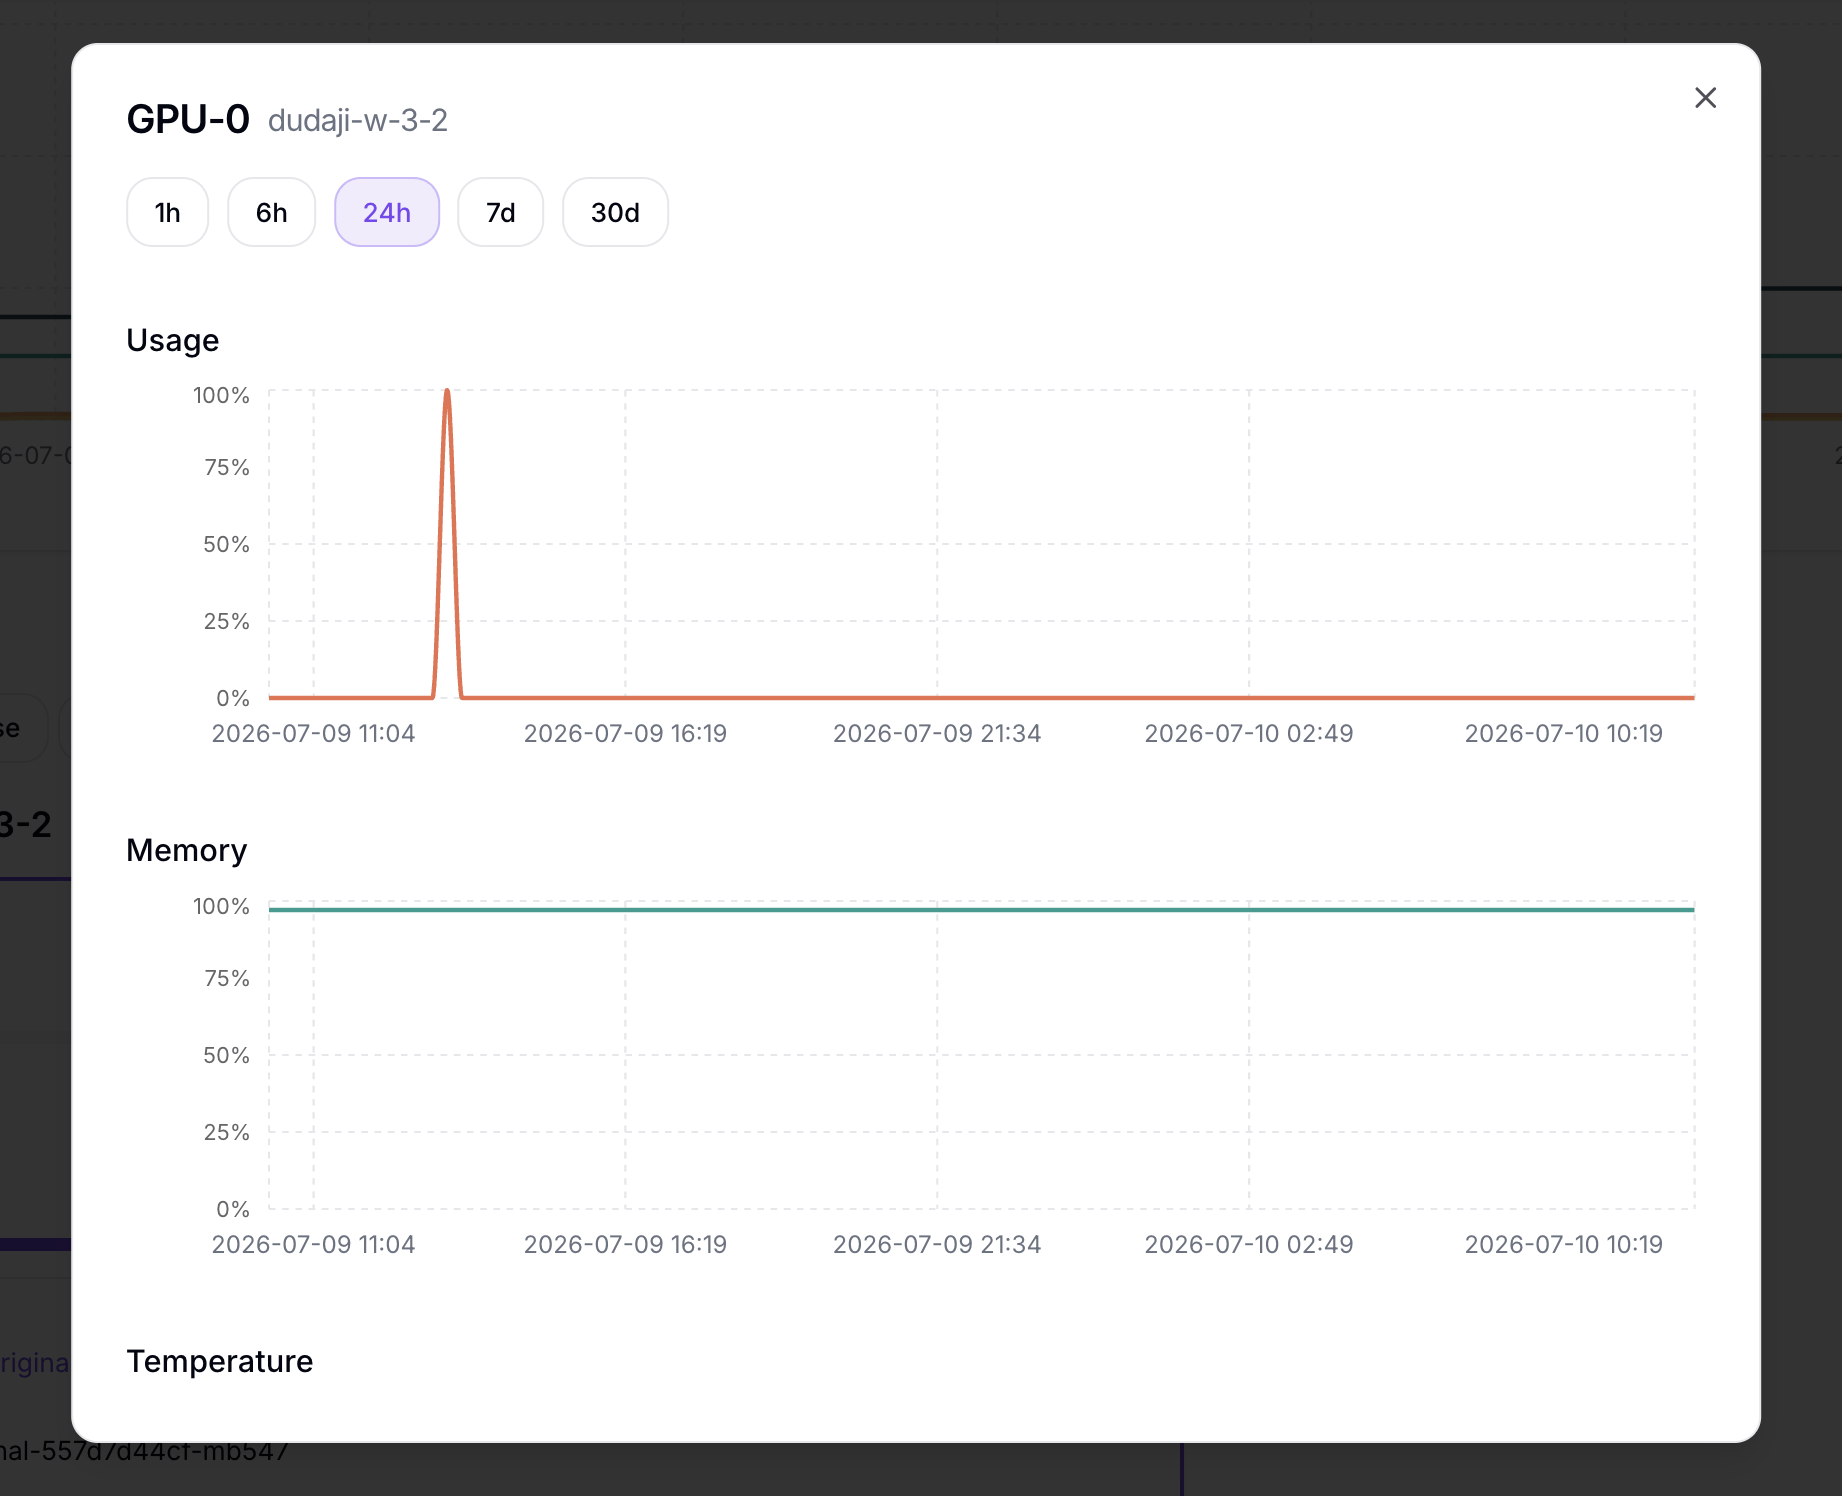
Click a node card or a device card to see the time-series graph for that item.
- Click a node card
- Click a device card
Shows the CPU / Memory / Disk time-series graphs for that node.
Shows the Usage / Memory / Temperature / Power time-series graphs for that device.
Responding to Anomalies
If you observe the following situations during monitoring, take the actions below.
| Symptom | Action |
|---|---|
| Device temperature overheating | Check the Temperature Policy in Advanced Deployment Settings, and verify that auto scale-down or traffic restriction kicks in when the threshold is exceeded. |
| Accelerator utilization stuck at 100% | Increase Replicas in Deploy a Model, or adjust the Auto Scaling settings. |
| Node memory/disk exhaustion | Stop unnecessary Servings, or clean up unused Volumes in Storage. |